
A Bridge on Economic Issues between China and the World



 Facebook
 Twitter
 Instagram
 WeChat
 Email
Commanding the Heights: China’s Economic Vertical Structure and the Logic of SOE Reform
China’s state-owned enterprises (SOE) dominate key upstream industries such as energy, telecommunications, and finance, while downstream industries are largely open to private competition. We refer to this asymmetry in both state ownership and market structure along the supply chain as the vertical structure. It explains why SOE profitability surged after China’s accession to the World Trade Organization, why upstream monopoly depresses industrialization, gross domestic product, and welfare, and why removing preferential credit subsidies to SOEs without dismantling the upstream monopoly could make things worse. More generally, we provide a novel and unified framework to explore important issues in China’s economic growth within the explicit context of the following three simultaneous structural processes: industrialization, trade globalization, and market-oriented reforms of SOEs.

A puzzle at the heart of the SOE debate
Few questions in Chinese political economy generate more controversy than the proper role of state-owned enterprises (SOE). The debate over “the state advances, the private sector retreats” (guo jin min tui, 国进民退) has flared repeatedly over the past two decades, and the direction of SOE reform remains contested today. A large body of literature documents that SOEs are less productive than private firms (Dollar and Wei 2007, Hsieh and Song 2015) and that they enjoy preferential access to credit (Song et al. 2011, Lardy 2014).
Against this backdrop, one fact has long puzzled observers. After China’s accession to the World Trade Organization (WTO) in December 2001, the profit margin of SOEs relative to non-SOEs improved dramatically. We define profit margin as total profits divided by sales revenue. By the mid-2000s the aggregate profit margin of state-owned and state-holding industrial enterprises exceeded that of other firms, reversing the pattern of the 1990s (Figure 1); firm-level regressions with controls confirm the relative improvement, though margins never fully overtake. This seems to contradict a basic prediction: Trade liberalization intensifies competition, which should hurt less efficient firms first. Some commentators concluded from the profit boom that no further reform was needed.
Figure 1. Performance of SOEs relative to non-SOEs
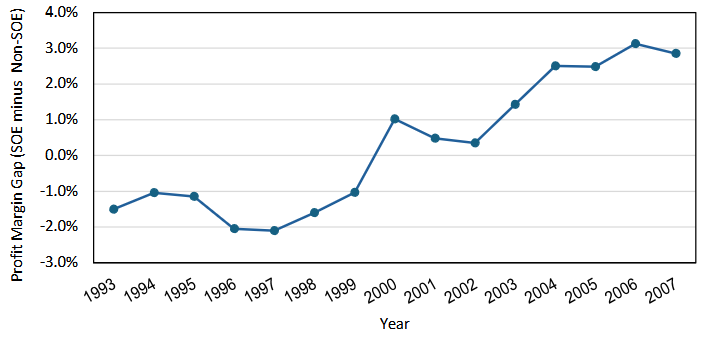
Note: We use CEIC (Table CN.BF: Industrial Financial Data: By Enterprise Type) to obtain profit margin defined as total profit to sales revenue. In this table, CEIC categorizes industrial enterprises into state-owned and holding, private, HMT and foreign, collectively owned, shareholding corporations, foreign funded, and Hong Kong, Macau, and Taiwan funded. We plot the profit margin of state-owned and holding enterprises minus that of the rest.
In Li et al. (2026), we argue that this conclusion gets the story backward. SOE prosperity in that period was not evidence that reform had succeeded or become unnecessary. It was a symptom of incomplete reform, generated by a largely overlooked structural feature: the economy’s vertical structure.
The vertical structure
By vertical structure we mean the asymmetry in both ownership and market structure between upstream and downstream industries. Following the “grasp the large, let go of the small” reforms of the late 1990s, the state privatized or closed most small and medium-sized SOEs, which were concentrated in downstream industries such as apparel, footwear, and consumer goods. At the same time, it retained and consolidated control of large SOEs in strategic industries: defense, electric power and grid, petroleum and petrochemicals, telecommunications, coal, civil aviation, and shipping. These turned out to be mostly upstream industries.
Using China’s input-output tables and the upstreamness methodology of Antràs et al. (2012), we document the pattern. SOEs accounted for well over half of upstream value added throughout 2002 to 2007, while their share in downstream industries fell below 20% and eventually below 10% (Figure 2). Upstream industries had profit margins and concentration indices roughly three times those of downstream industries, and served mainly the domestic market, with an export-to-output ratio of 5.5% versus 21.9% downstream. These patterns survive controls for capital intensity and alternative definitions of state ownership.
Figure 2. SOE share distribution across the upstream and downstream in the industrial sector
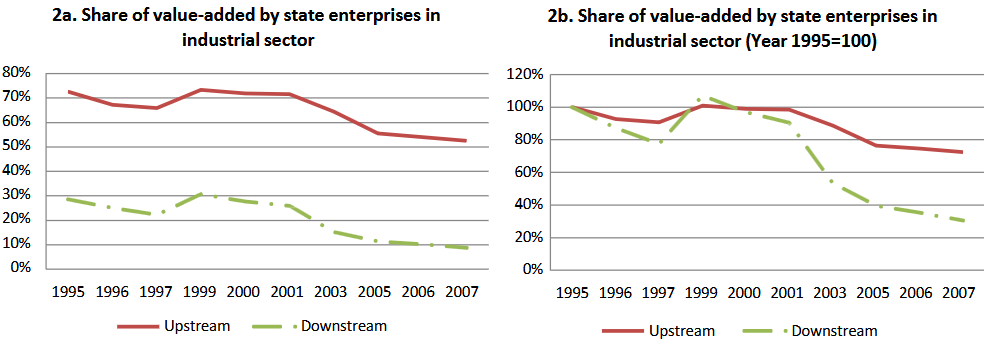
Note: Figure 2 reports the share of state enterprises in industrial value added using data from the National Bureau of Statistics (NBS) of China, Table 14-2, and Table 14-6. Note that NBS has changed the title of state-related enterprises over time. NBS uses “state-owned industrial enterprises” in 1995–1997 and “state-owned and state-holding” in 1999–2003 and 2005–2007. The data are missing for 1998, 2002, and 2004.
How downstream dynamism enriches upstream monopolists
We build a parsimonious general-equilibrium model to analyze how this structure shapes the economy. The model has an agricultural sector and an industrial sector; within industry, an upstream monopolist SOE supplies an essential intermediate input to perfectly competitive downstream private firms. Labor is abundant in agriculture, so wages stay low during industrialization, in the spirit of the Lewis model.
The central mechanism is simple but powerful. When downstream private firms become more productive, or when trade liberalization expands foreign demand for downstream goods, downstream output expands and labor flows out of agriculture into industry. Because every unit of downstream production requires the upstream input, the derived demand for that input rises, allowing upstream monopolists to sell more and earn higher profits. Downstream dynamism thus translates directly into upstream SOE profits. WTO accession enriched upstream SOEs precisely because it energized the private downstream firms they supply, even though upstream SOEs barely participate in trade themselves. The prediction is the exact opposite under the horizontal structure assumed in the resource misallocation literature (Hsieh and Klenow 2009), where private productivity growth erodes SOE profits through head-to-head competition in the same sector.
The model also delivers a sobering welfare result. The upstream monopoly restricts the supply of the essential input, raises downstream costs, and thereby slows the reallocation of labor from agriculture into industry. Reducing upstream market power would accelerate industrialization, raise gross domestic product and returns on capital, and increase aggregate welfare. High SOE profits were a consequence of growth driven by downstream private firms, not a cause of it. We further show that the vertical structure can emerge endogenously: When private firms are sufficiently more productive, liberalizing the downstream while monopolizing the upstream is exactly what maximizes economy-wide SOE profits.
Firm-level evidence for the mechanism
The theory makes sharp predictions that we test with the Annual Survey of Industrial Enterprises from 1998 to 2007. First, the post-2001 improvement in SOE profitability should not merely be a composition effect of bad SOEs exiting. In balanced panels of continuing firms, the profitability gap still narrows. Second, and more distinctively, the improvement should be concentrated among upstream SOEs. Relative to the same benchmark of mid- and downstream non-SOEs, upstream SOEs show a pronounced post-2001 gain in profit margins, while mid- and downstream SOEs show none. Third, positive downstream total factor productivity (TFP) and/or demand shocks should raise upstream profits. Using input-output weights, we find that downstream TFP growth significantly raises upstream firms’ profit growth, and reductions in the export tariffs facing downstream industries do the same.
Two distortions that partially offset each other
Preferential credit to SOEs is usually treated as a straightforward distortion to be removed. Our framework suggests a more nuanced view. In the presence of the upstream monopoly, the fundamental problem is under-supply of the upstream input. A credit subsidy to the upstream SOE lowers its cost of capital, expands its output, and thereby mitigates the monopoly distortion; there exists a unique second-best subsidy rate that exactly offsets the markup. Companion work (Chen et al. 2026) finds the same second-best logic in China’s broader industrial policy: Preferential credit to high-markup sectors offsets under-allocation and raises aggregate productivity.
Calibrating the model to 2005 firm-level data, we quantify the two distortions. Eliminating the upstream monopoly alone would have raised GDP by 5.5%; eliminating both distortions together, by 7.6%. But eliminating the credit subsidy alone would have reduced GDP by 1.2%, because the subsidy was partially correcting the monopoly’s under-supply; this negative effect holds in every year from 2004 to 2007. Reform sequencing therefore matters: Dismantle the monopoly first, and removing the subsidy afterwards raises welfare monotonically; remove the subsidy first, and welfare can fall below its starting point before the monopoly is addressed.
How much of the problem is state ownership itself?
Upstream industries command high markups everywhere in the world; what is distinctive about China is the prevalence of state ownership within them. Using the markup estimation of De Loecker and Warzynski (2012), we find that upstreamness, not state ownership, is the primary driver of market power: SOEs charge a markup premium only in upstream industries, not in downstream industries. A counterfactual that converts all upstream SOEs into private firms would recover only roughly 8.5 to 15.5% of the total output loss from the upstream SOE monopoly, which implies that it does not help much if upstream SOEs are simply privatized without dismantling their monopoly power. What matters is the upstream monopoly, not state ownership per se. If the upstream state monopolists are replaced by politically connected private firms, as we observe in countries like Mexico, the root of inefficiency remains intact. The effective reform is to foster competition in the upstream sectors, for example, by lowering the entry barrier.
Implications for other countries
This paper shows how the vertical structure interacts with structural change, trade globalization, labor abundance, and credit subsidies to SOEs in the Chinese economy and explores their quantitative implications on total output and social welfare. However, the framework may help us better understand similar issues in other emerging markets For example, when comparing China and India through the lens of the vertical structure framework, we can easily detect that a crucial bottleneck for India’s industrialization is the severe underdevelopment in upstream sectors such as electricity and water supply, which strangles the structural change process of agriculture into manufacturing despite the fact that India also has abundant labor and joined WTO even earlier than China. When comparing China and Russia with this vertical structure framework, we immediately find that, in Russia, upstream sectors are so well naturally endowed (for example, natural gas and oil) that it is the upstream sectors that directly export, in sharp contrast with China, where upstream sectors are largely importing. The downstream sectors in Russia are not very competitive, partly due to the relatively high labor cost and relatively low pressure of import competition. Russia joined WTO in August 2012 as the 156th member nation, almost eleven years after China. Besides, its natural gas and petroleum are largely in the hands of oligarchs and thus subject to markup pricing, which would have a negative impact on downstream industrial development. On the other hand, underdevelopment in downstream sectors implies a limited domestic demand for upstream natural resources and hence a relatively small contribution of downstream sectors to upstream profits.
Xi Li, University of Arkansas; Xuewen Liu, University of Hong Kong; Zhikun Lu, NYU Shanghai; Yong Wang, Peking University.
References
Antràs, Pol, Davin Chor, Thibault Fally, and Russell Hillberry. 2012. “Measuring the Upstreamness of Production and Trade Flows.” American Economic Review 102 (3): 412–416. https://doi.org/10.1257/aer.102.3.412.
Chen, Kaiji, Yuxuan Huang, Xuewen Liu, Zhikun Lu, and Yong Wang. 2026. “Preferential Credit Policy with Sectoral Markup Heterogeneity.” Journal of International Economics 161: 104238. https://doi.org/10.1016/j.jinteco.2026.104238.
De Loecker, Jan, and Frederic Warzynski. 2012. “Markups and Firm-Level Export Status.” American Economic Review 102 (6): 2437–71. https://doi.org/10.1257/aer.102.6.2437.
Dollar, David, and Shang-Jin Wei. 2007. “Das (Wasted) Kapital: Firm Ownership and Investment Efficiency in China.” National Bureau of Economic Research Working Paper No. 13103. https://www.nber.org/papers/w13103.
Hsieh, Chang-Tai, and Peter J. Klenow. 2009. “Misallocation and Manufacturing TFP in China and India.” Quarterly Journal of Economics 124 (4): 1403–48. https://doi.org/10.1162/qjec.2009.124.4.1403.
Hsieh, Chang-Tai, and Zheng Michael Song. 2015. “Grasp the Large, Let Go of the Small: The Transformation of the State Sector in China.” Brookings Papers on Economic Activity, 295–346. https://www.jstor.org/stable/43684105.
Lardy, Nicholas R. 2014. Markets Over Mao: The Rise of Private Business in China. Columbia University Press.
Li, Xi, Xuewen Liu, Zhikun Lu, and Yong Wang. 2026. “A Model of China's Economic Vertical Structure.” Journal of Public Economics 259: 105662. https://doi.org/10.1016/j.jpubeco.2026.105662.
Song, Zheng, Kjetil Storesletten, and Fabrizio Zilibotti. 2011. “Growing Like China.” American Economic Review 101 (1): 196–233. https://doi.org/10.1257/aer.101.1.196.

Latest
Most Popular
- VoxChina Covid-19 Forum (Second Edition): China’s Post-Lockdown Economic Recovery VoxChina, Apr 18, 2020
- China’s Great Housing Boom Kaiji Chen, Yi Wen, Oct 11, 2017
- China’s Joint Venture Policy and the International Transfer of Technology Kun Jiang, Wolfgang Keller, Larry D. Qiu, William Ridley, Feb 06, 2019
- The Dark Side of the Chinese Fiscal Stimulus: Evidence from Local Government Debt Yi Huang, Marco Pagano, Ugo Panizza, Jun 28, 2017
- Wealth Redistribution in the Chinese Stock Market: the Role of Bubbles and Crashes Li An, Jiangze Bian, Dong Lou, Donghui Shi, Jul 01, 2020
- Evaluating Risk across Chinese Housing Markets Yongheng Deng, Joseph Gyourko, Jing Wu, Aug 02, 2017
- Daily Price Limits and the Magnet Effect Ting Chen, Zhenyu Gao, Jibao He, Wenxi Jiang, Wei Xiong, Oct 25, 2017
- What Is Special about China’s Housing Boom? Edward L. Glaeser, Wei Huang, Yueran Ma, Andrei Shleifer, Jun 20, 2017
- Privatization and Productivity in China Yuyu Chen, Mitsuru Igami, Masayuki Sawada, Mo Xiao, Jan 31, 2018
- How did China Move Up the Global Value Chains? Hiau Looi Kee, Heiwai Tang, Aug 30, 2017