A Bridge on Economic Issues between China and the World


 Facebook
  Twitter
  Instagram
 WeChat
  Email
Email How did China Move Up the Global Value Chains?

The paper examines China's rising domestic content in exports using firm and customs transaction-level data. China's domestic content in exports increased from 65 percent in 2000 to 70 percent in 2007. The key reason for China’s ascent on global value chains is due to individual processing exporters substituting domestic products for imported materials, induced by the country’s trade and FDI liberalizations.
In recent decades, declining trade barriers and advances in information and communication technologies have induced firms to source inputs more globally. Indeed, recent research shows a declining share of domestic content in countries’ aggregate exports, despite rising trade volume (e.g., Koopman, Wang, and Wei, 2014; Johnson and Noguera, 2016). The iPhone, which bears an engraving that says “designed by Apple in California. Assembled in China,” best exemplifies this trend. However, the iPhone’s marking only reveals the first and final steps of a long and complex production process. Over a hundred suppliers from around the world produce its various components and export them to China for final assembly. The bulk of the revenues from the iPhone’s retail sales are paid to Apple and several key multinational firms that provide its most essential inputs. Only 1.8 percent of the iPhone’s price is used to pay the wage bill of Chinese assembly workers (Kraemer, Linden, and Dedrick, 2011).
How representative is the Apple example of China’s segment of global value chains? Do Chinese firms and workers still heavily rely on imported inputs while contributing little to the country’s exports?In our recent article published in American Economic Review (Kee and Tang, 2016), we find that China defies global trends and experiences an increasing level of domestic content in its exports since its accession to the World Trade Organization in late 2001. Using comprehensive manufacturing firm and customs transaction-level data, we systematically explore the domestic segment of global value chains in China from 2000 to 2007. We find that the share of domestic content in Chinese exports — or the ratio of domestic value added in exports to gross exports (DVAR) — has steadily increased from 65 percent in 2000 to 70 percent in 2007 (see Figure 1). The ascent of China’s processing sector is even steeper — from 46 percent in 2000 to 55 percent in 2007 (see Figure 2). Figure 3 highlights the upward trend for most industries, including the machinery, mechanical, and electrical equipment sector — which comprises Foxconn, the company that completed the final stage of the production of Apple products.
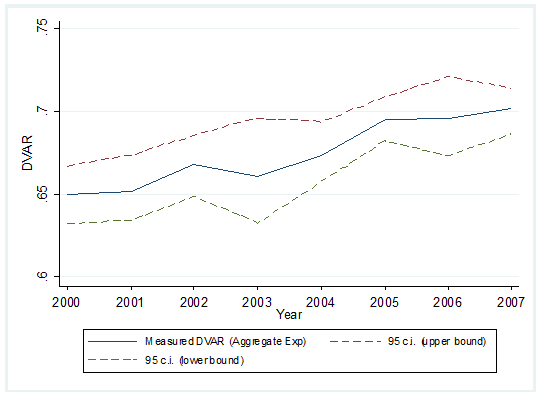 Source: Kee and Tang (2016)
Figure 2: DVAR of Processing Exports (2000-2007)
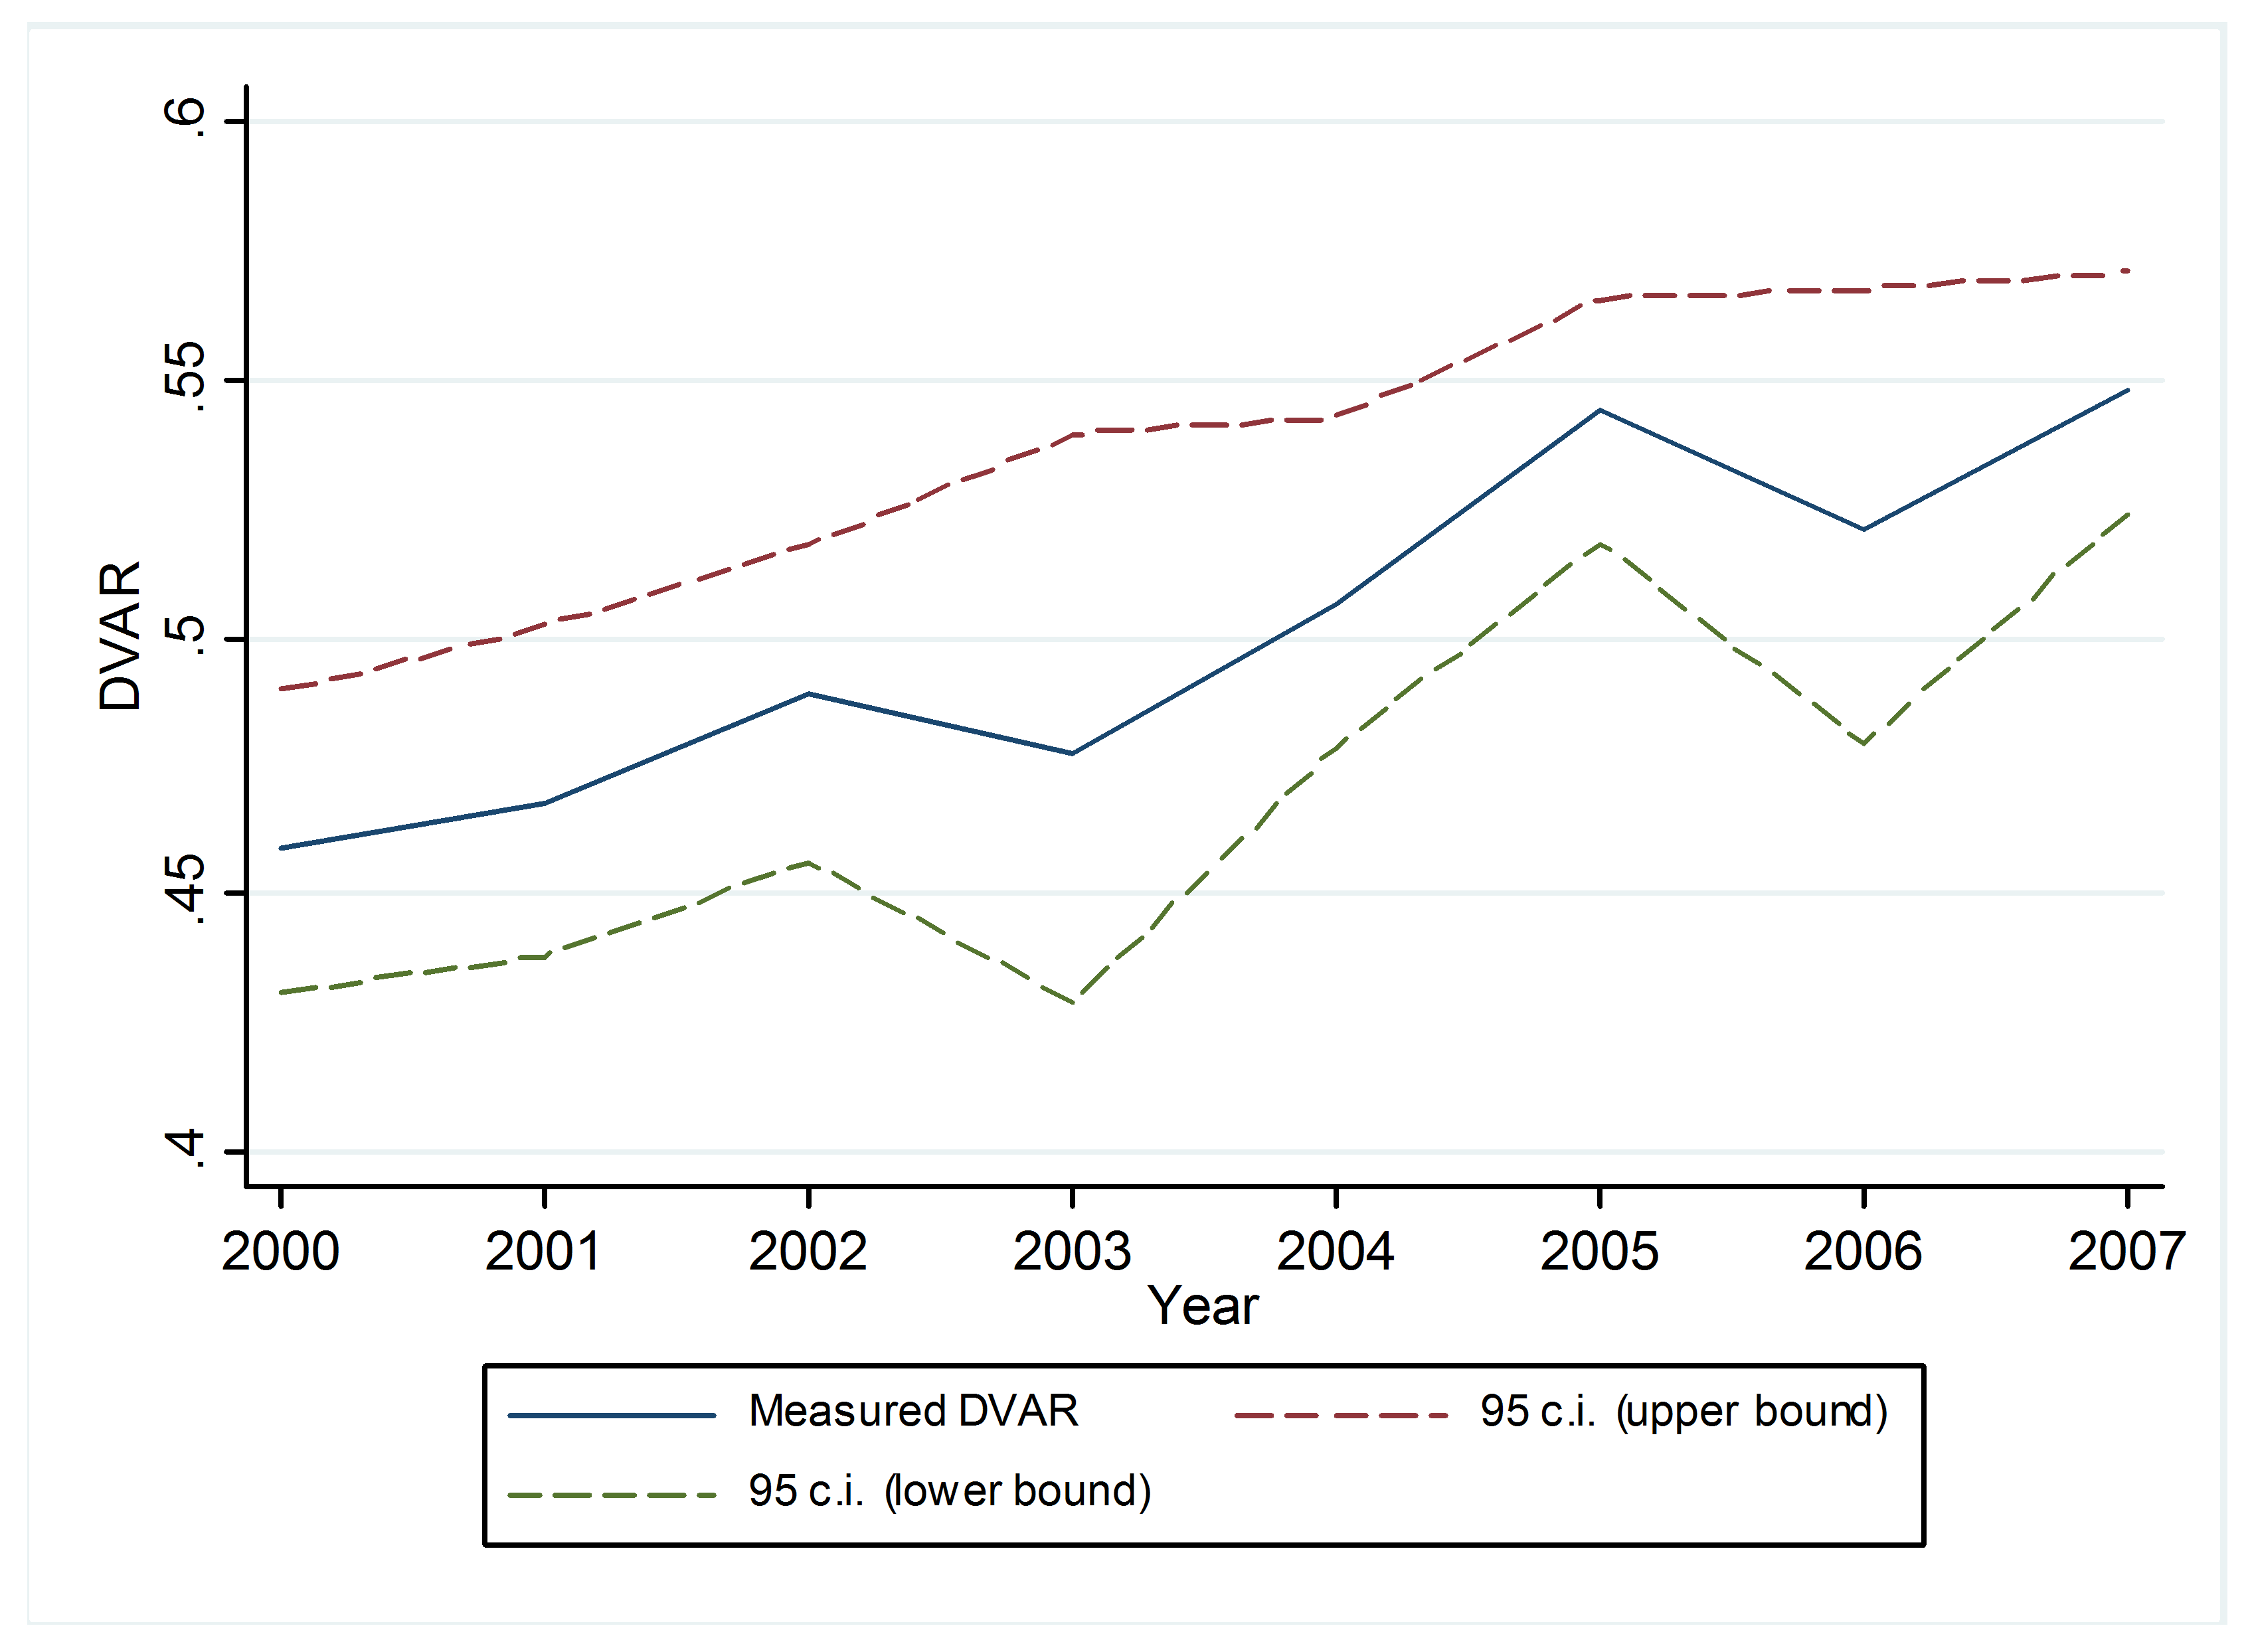 Source: Kee and Tang (2016)
Figure 3: DVAR Trend (2000-2007) by Industry
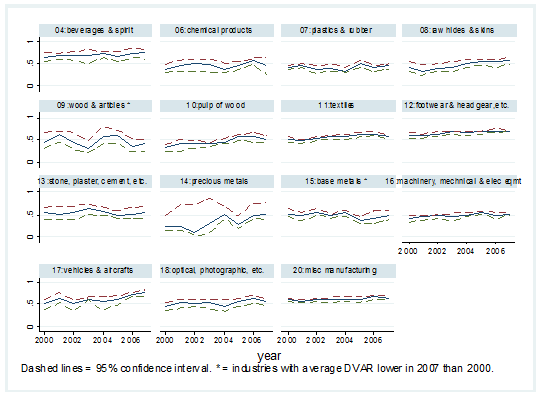 Source: Kee and Tang (2016)
What caused China to upend the global trend of declining domestic content in exports despite its increasing participation in global value chains? There are several possibilities. The phenomenon could be due to China’s shifting its comparative advantage from low value-added industries to high value-added industries. It could also be a result of its increasing domestic production costs. Another possibility is that firms in China may have gradually shifted their sourcing of intermediate inputs from foreign to domestic suppliers.
Our empirical evidence supports the third possibility; namely, that China’s growing domestic content in exports is due to its exporting firms gradually replacing imported inputs with domestic products. We develop a model that pins down a structural relationship between the prices of domestic materials relative to foreign materials and firms’ DVAR. We then construct the relative price index of domestic inputs using our micro data and use a 3SLS model to empirically examine how China’s tariff and foreign direct investment (FDI) liberalizations affect exporters’ DVAR. We find that the DVAR is affected through changing domestic input varieties and hence the relative prices of domestic materials.
Our regression results show that exporting firms’ substitution of foreign inputs with domestic inputs is induced by both liberalizations in the early 2000s. Existing studies show that FDI can increase the demand for domestic materials, thus raising the supply and quality of domestic input varieties from the upstream industries due to the scale effect (Kee, 2015). Tariff liberalization, on the other hand, gives domestic suppliers access to newer, cheaper, or better imported inputs, which lowers their production costs both directly and indirectly due to endogenous improvement in productivity (Goldberg et al., 2010). As a result, external liberalization encourages China’s intermediate input producers to expand product variety, therefore lowering domestic input prices and inducing individual processing exporters to substitute domestic for imported materials.
Other factors, such as rising wages and capital costs in China, the changing composition of exports towards high value-added industries, the potential decrease in the prevalence of processing trade, or firm entry and exit, cannot explain the upward trend over the period of analysis. In other words, the phenomenon of China’s “moving up the value chain” takes place within firms.
Methodologically, our granular approach differs from the common approach adopted in the existing literature on the measurement of the DVAR of exports, which relies on figures drawn from countries’ input-output (IO) tables. Our approach takes firm heterogeneity into account in order to reduce aggregation bias. In fact, we empirically show that ignoring firm heterogeneity in the IO table-based approach may lead to downward biased estimates of the aggregate DVAR. This is due to the fact that in the construction of IO tables, large firms tend to be oversampled. Given that larger firms tend to import relatively more goods and therefore have lower DVAR (Amiti, Itskhoki, and Konings, 2014), the IO table-based approach yields lower estimates of the aggregate DVAR.
Many developing countries have tried to implement policies to shore up the domestic content in exports. It is widely believed that higher domestic content levels would boost the economic benefits of trade — such as the trade-induced innovation and domestic input-output propagation — as an economy moves up the value chain. A higher DVAR of exports also implies a higher share of exports in a country’s GDP for a given level of aggregate exports.
These findings also lend support to recent research about the global trade slowdown after the 2008–2009 financial crisis (e.g., Constantinescu et al., 2015). When Chinese firms decide to source more inputs domestically, they trade less with the rest of the world. In a global economy characterized by roundabout input-output linkages, a reduced demand for imports from China may have substantial consequences for world trade.
In sum, our findings suggest that liberalizing trade and FDI is key to the promotion of domestic value added into a country’s exports. Policies that promote import substitution or impose domestic content requirements on exporting firms may produce counter-productive effects (e.g., World Bank, 2011). In an ongoing project, using the World Bank’s Exporter Dynamic Database to match importer-exporter customs transaction data, we employ the same method as is outlined in this paper to measure the DVAR of exports for a wide range of countries. We find an upward trend in the DVAR of exports for countries as diverse as Bangladesh, Guatemala, Madagascar, and Morocco, which all share open trade and FDI policies similar to China.
(Hiau Looi Kee, the World Bank Research Department; Heiwai Tang, Johns Hopkins School of Advanced International Studies.)
Amiti, M., O. Itskhoki, and J. Konings (2014), “Importers, Exporters, and Exchange Rate Disconnect,” American Economic Review 104 (7): 1942–1978.
Constantinescu, C., A. Mattoo, and M. Ruta (2015), “The Global Trade Slowdown: Cyclical or Structural?” World Bank Policy Research Working Paper, WPS 7158.
Johnson, R., and G. Noguera (2016), “A Portrait of Trade in Value Added Over Four Decades,” Review of Economics and Statistics, forthcoming.
Goldberg, P., A. Khandelwal, N. Pavcnik, and P. Topalova (2010), “Imported Intermediate Inputs and Domestic Product Growth: Evidence from India,” Quarterly Journal of Economics 125 (4): 1727-1767.
Kee, H. L. (2015), “Local Intermediate Inputs and the Shared Supplier Spillovers of Foreign Direct Investment,” Journal of Development Economics 112, 56-71.
Kee, H. L., and H. Tang (2016), “Domestic Value Added in Exports: Theory and Firm Evidence from China” American Economic Review 106 (6): 1402-1436.
Koopman, R, Z. Wang, and .S-J. Wei (2012), “Estimating Domestic Content in Exports When Processing Trade is Pervasive,” Journal of Development Economics 99 (1): 178-189.
Kraemer, K. L., G. Linden, and J. Dedrick (2011), “Capturing Value in Global Networks: Apple’s iPad and iPhone,” University of California, Berkeley, Working Paper.
World Bank (2011), Harnessing Regional Integration for Trade and Growth in Southern Africa.

Latest
Most Popular
- VoxChina Covid-19 Forum (Second Edition): China’s Post-Lockdown Economic Recovery VoxChina, Apr 18, 2020
- China’s Great Housing Boom Kaiji Chen, Yi Wen, Oct 11, 2017
- China’s Joint Venture Policy and the International Transfer of Technology Kun Jiang, Wolfgang Keller, Larry D. Qiu, William Ridley, Feb 06, 2019
- The Dark Side of the Chinese Fiscal Stimulus: Evidence from Local Government Debt Yi Huang, Marco Pagano, Ugo Panizza, Jun 28, 2017
- Wealth Redistribution in the Chinese Stock Market: the Role of Bubbles and Crashes Li An, Jiangze Bian, Dong Lou, Donghui Shi, Jul 01, 2020
- Evaluating Risk across Chinese Housing Markets Yongheng Deng, Joseph Gyourko, Jing Wu, Aug 02, 2017
- What Is Special about China’s Housing Boom? Edward L. Glaeser, Wei Huang, Yueran Ma, Andrei Shleifer, Jun 20, 2017
- Privatization and Productivity in China Yuyu Chen, Mitsuru Igami, Masayuki Sawada, Mo Xiao, Jan 31, 2018
- Daily Price Limits and the Magnet Effect Ting Chen, Zhenyu Gao, Jibao He, Wenxi Jiang, Wei Xiong, Oct 25, 2017
- How did China Move Up the Global Value Chains? Hiau Looi Kee, Heiwai Tang, Aug 30, 2017


