A Bridge on Economic Issues between China and the World


 Facebook
  Twitter
  Instagram
 WeChat
  Email
Email Wealth Redistribution in the Chinese Stock Market: the Role of Bubbles and Crashes

Using comprehensive administrative data from China, we document a substantial increase in inequality of wealth held in risky assets by Chinese households in the 2014–2015 bubble-crash episode: the top 0.5% households in the equity market gained, while the bottom 85% lost, 250B RMB through active trading in this period, equating to 30% of each group’s initial equity wealth. In comparison, the return differential between the top and bottom groups in periods of a relatively calm stock market is an order of magnitude smaller. We examine a number of possible explanations for these findings and discuss their implications.
The past half century has witnessed a worldwide surge in wealth inequality (e.g., Alvaredo et al. 2013; Alvaredo et al. 2018). The most alarming aspect of this finding is a sharp increase in the wealth share of the ultra-wealthy (e.g., the top 0.01% of the wealth distribution). This rise in wealth concentration could be in part due to an increase in income disparity, but it may also be driven by heterogenous returns from financial investments. In his best-selling book, Piketty (2014) emphasizes this last factor in driving wealth inequality when he writes, “[I]t is perfectly possible that wealthier people obtain higher average returns than less wealthy people.” Bach et al. (2019), Campbell et al. (2019), and Fagereng et al. (2019) provide consistent evidence in the context of Northern European and Indian markets.
The 2014–2015 Bubble-Crash in the Chinese Stock Market
In our recent study, we examine the impact of stock market investment on the concentration of household wealth held in equities in the Chinese setting. Particularly, we emphasize the role of bubbles and crashes in driving wealth inequality; we focus on these extreme episodes for three main reasons. First, bubble-crash episodes are almost always accompanied by extraordinary levels of trading volume and return volatilities, which can give rise to wealth redistribution on an enormous scale. Second, relative to calm periods, it is less clear who wins and who loses in bubbles and crashes. For example, Sir Isaac Newton, one of the greatest scientists in human history and a savvy investor, lost his lifetime savings through massive bets in the South Sea bubble.
The third and perhaps most important reason is that while bubble-crash episodes occur infrequently in developed countries, they are much more common in developing economies. Given the recent finding that salient, early-life experiences affect individuals’ economic decisions decades later (e.g., Malmendier and Nagel, 2011), these repeated occurrences of extreme price movements, albeit short-lived, can have long-lasting impacts on the behavior and welfare of hundreds of millions of households in these countries (e.g., Badarinza et al. 2019).
Our main setting is the bubble-crash episode in China from July 2014 to December 2015, when the Chinese stock market experienced a roller-coaster ride: the Shanghai Composite Index climbed more than 150% from the beginning of July 2014 to its peak on June 12, 2015, before crashing 40% by the end of December 2015. To contrast wealth redistribution in this extreme episode with that in calm market conditions, we repeat our analyses using the two-and-half years prior to June 2014, when the market was relatively calm.
Different Investor Groups in the Market
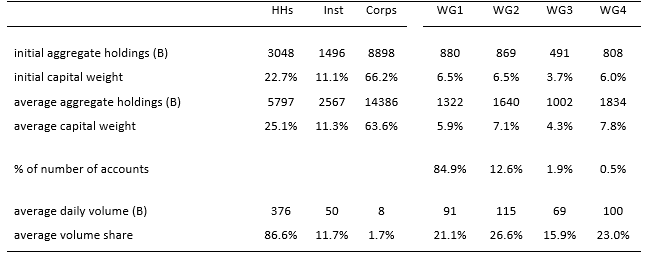
We obtain administrative data from the Shanghai Stock Exchange, which include detailed holdings and trading records of the entire investor population of around 40M accounts. At the broadest level, we classify all accounts into three categories: those owned by households, institutions, and corporations. The last category includes both cross-holdings by other firms and ownership by government-sponsored entities. Household accounts are further stratified into four groups based on account value (the sum of equity holdings in both the Shanghai and the Shenzhen stock exchanges plus cash in the account) at the beginning of our sample with the following cutoffs: below 500k RMB (WG1), 500k to 3 million RMB (WG2), 3 million to 10 million RMB (WG3), and above 10 million RMB (WG4).
Table 1 shows the account value and trading volume (in billion RMB) of various investor groups. On average, corporations hold 64% of the market value but contribute less than 2% of the trading volume. Institutions are responsible for 11% of the market value and 12% of the trading volume. Finally, households account for 25% of the market value but nearly 90% of the trading volume. Within the household sector, capital weight and volume share are relatively balanced across the four groups. In terms of the number of accounts, however, the bottom wealth group includes 85% of all household accounts while the top wealth group includes 0.5% of all household accounts.
Capital Flows and the Resulting Wealth Effect
We focus our analysis squarely on the household sector, which constitutes nearly 90% of total trading. As shown in Figure 1, in the boom period, the top 0.5% households moved into the stock market while the bottom 85% reduced their stock market exposure. Shortly after the peak, the wealthy quickly exited the market, selling their shares partly to smaller households and partly to corporations.
Figure 1. Cumulative Flows of Households in the Bubble-Crash Period
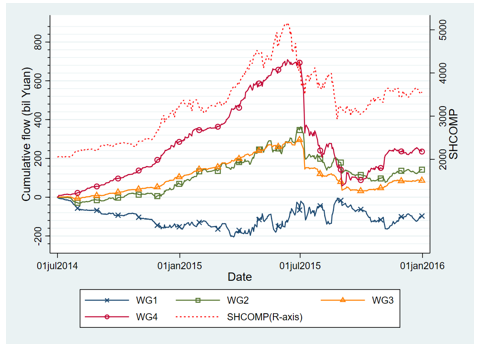
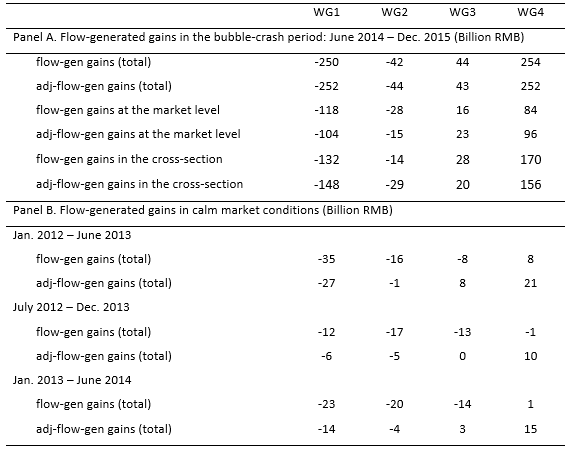
Figure 2. Cumulative Flow-Generated Gains of Households
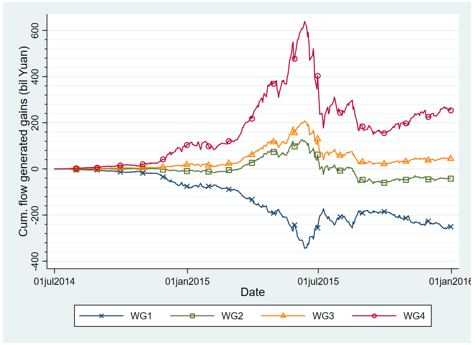
In stark contrast, wealth redistribution in calm market conditions is an order of magnitude smaller than that in the bubble-crash episode. As shown in Table 2, for any 18-month subperiod in the two-and-half years prior to June 2014, the ultra-wealthy (those in the top 0.5% of the equity wealth distribution) enjoy a gain of up to 21B RMB, which translates to a percentage gain of 3% of their initial equity wealth (compared to the 30% gain in the bubble-crash period). We observe losses of similar magnitudes by the bottom household group in this two-and-half-year period.
Potential Explanations
We consider a number of possible explanations for our findings. Perhaps the most natural explanation is that investors with different levels of financial wealth have different rebalancing needs. Indeed, a simple portfolio-choice model that allows for heterogeneous exposures to the stock market can generate part of the flow patterns in our study. However, such rebalancing-motivated trades—and more generally, any feedback trading strategy that is a linear function of realized market returns—can only account for a small fraction (less than 10%) of the observed wealth transfer across household groups.
We instead argue that the wealth redistribution in our sample is at least in part due to differences in households’ investment skills. We show that nearly half of the 100B RMB redistribution at the market level is due to small investors’ poor market-timing. Compared with accounts that exist at the beginning of the bubble, new entrants to the market during the bubble period (who are usually less experienced) suffer disproportionate losses; new entrants account for 30% of the wealth transfer at the market level, but only 18% of the invested capital. In the cross-section of stocks, we find that trading by the bottom 85% households significantly and negatively forecasts future stock returns, while that by the top 0.5% positively predicts stock returns.
The key takeaway from our study is that the heterogeneity in market timing and stock selection ability between the poor and the ultra-wealthy, while also present in calm periods, is greatly amplified in bubble-crash episodes, when both volatilities and trading volume spike.
Further Implications
Our finding that the largest 0.5% households make a windfall in a bubble-crash episode at the expense of the bottom 85% has implications for policymakers. It is often believed that greater stock market participation (or participation in any other risky financial market) is a path to prosperity and equality, especially in developing countries where financial literacy and market participation are generally low. However, if the poor, less financially sophisticated invest actively in financial markets that are prone to bubbles and crashes, such participation can be detrimental to their wealth.
This is particularly concerning given the recent finding that salient early life experiences have long-lasting impacts on individuals’ economic decisions decades later. Consequently, policymakers and academics must emphasize that while greater stock market participation can be welfare-improving—especially for the poor—active investment by the poor will likely result in the exact opposite.
(Li An, Tsinghua PBC School of Finance; Jiangze Bian, University of International Business and Economics; Dong Lou, London School of Economics and CEPR; Donghui Shi, Shanghai Stock Exchange and Fanhai International School of Finance, Fudan University.)
References
Alvaredo, Facunto, Anthony B. Atkinson, Thomas Piketty, and Emmanuel Saez, 2013, The Top 1 Percent in International and Historical Perspective, Journal of Economic Perspectives, 27(3), 3-20.
Alvaredo, Facundo, Lucas Chancel, Thomas Piketty, Emmanuel Saez, and Gabriel Zucman, 2018, World Inequality Report 2018, Belknap Press.
Bach, Laurent, Laurent E. Calvet, and Paolo Sodini, 2019, Rich Pickings? Risk, Return, and Skill in the Portfolios of the Wealthy, American Economic Review, Forthcoming.
Badarinza, Cristian, Vimal Balasubramaniam, and Tarun Ramadorai, 2019, The Household Finance Landscape in Emerging Economies, Annual Review of Financial Economics, 11, 109-129.
Campbell, John Y., Tarun Ramadorai, Benjamin Ranish, 2019, Do the Rich Get Richer in the Stock Market? Evidence from India, American Economic Review: Insights, 1(2), 225-40.
Fagereng, Andreas, Luigi Guiso, Davide Malacrino, and Luigi Pistaferri, 2019, Heterogeneity and Persistence in Returns to Wealth, Econometrica, Forthcoming.
Malmendier, Ulrike, Stefan Nagel, 2011, Depression Babies: Do Macroeconomic Experiences Affect Risk Taking?, Quarterly Journal of Economics, 126(1), 373–416.
Piketty, Thomas, 2014, Capital in the Twenty-First Century, Harvard University Press.

Latest
Most Popular
- VoxChina Covid-19 Forum (Second Edition): China’s Post-Lockdown Economic Recovery VoxChina, Apr 18, 2020
- China’s Great Housing Boom Kaiji Chen, Yi Wen, Oct 11, 2017
- China’s Joint Venture Policy and the International Transfer of Technology Kun Jiang, Wolfgang Keller, Larry D. Qiu, William Ridley, Feb 06, 2019
- The Dark Side of the Chinese Fiscal Stimulus: Evidence from Local Government Debt Yi Huang, Marco Pagano, Ugo Panizza, Jun 28, 2017
- Wealth Redistribution in the Chinese Stock Market: the Role of Bubbles and Crashes Li An, Jiangze Bian, Dong Lou, Donghui Shi, Jul 01, 2020
- Evaluating Risk across Chinese Housing Markets Yongheng Deng, Joseph Gyourko, Jing Wu, Aug 02, 2017
- What Is Special about China’s Housing Boom? Edward L. Glaeser, Wei Huang, Yueran Ma, Andrei Shleifer, Jun 20, 2017
- Privatization and Productivity in China Yuyu Chen, Mitsuru Igami, Masayuki Sawada, Mo Xiao, Jan 31, 2018
- Daily Price Limits and the Magnet Effect Ting Chen, Zhenyu Gao, Jibao He, Wenxi Jiang, Wei Xiong, Oct 25, 2017
- How did China Move Up the Global Value Chains? Hiau Looi Kee, Heiwai Tang, Aug 30, 2017


