A Bridge on Economic Issues between China and the World


 Facebook
  Twitter
  Instagram
 WeChat
  Email
Email Tax Policy and Lumpy Investment Behavior: Evidence from China’s VAT Reform

To stimulate investment and promote production efficiency, the Chinese government has undertaken a series of value-added tax (VAT) reforms. One of those reforms, in 2009, reduced not only the purchasing price of equipment, but also investment frictions, i.e., the price gap imposed by the pre-reform VAT system between new and used equipment. We find that this reform increased equipment investment by 36% and, more importantly, the increase was driven by investment spikes (i.e., investment greater than 20% of capital stock). Using a dynamic investment model, we find that tax policies that directly reduce investment frictions, such as investment tax credits, are more effective in stimulating investment than policies such as corporate income tax cuts or bonus depreciation.

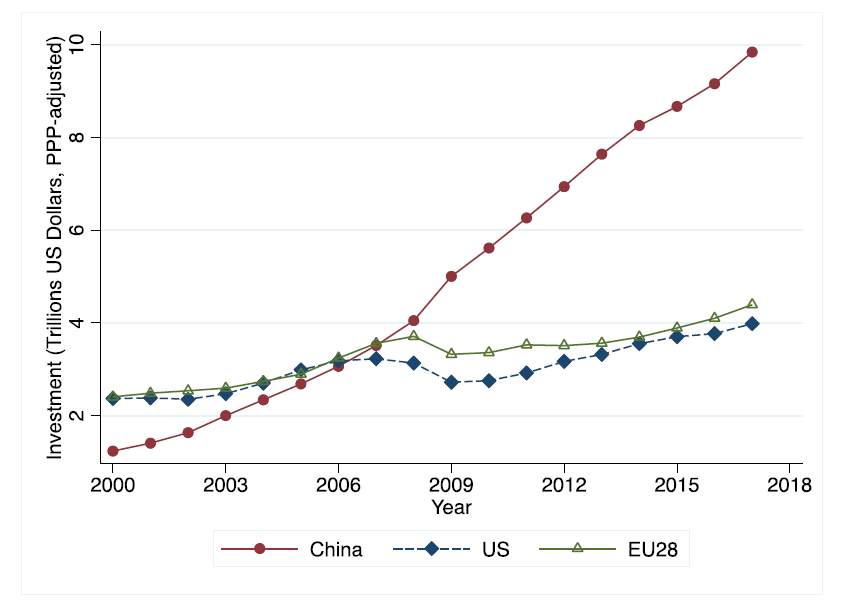
China has undertaken a series of value-added tax (VAT) reforms since 2004. The reforms began in the manufacturing sector and gradually expanded to the whole economy. These reforms aimed to improve economic efficiency and stimulate investment. In fact, the past decade has witnessed strong investment growth in China. As Figure 1 shows, total investment grew to more than double that in the US or the EU by 2016. VAT reforms, particularly in manufacturing, significantly increased investment in equipment (e.g., Cai and Harrison 2018; Liu and Mao 2019).
We show that tax policies interact with the investment frictions that generate lumpy investment. We use China’s 2009 VAT reform as an opportunity to investigate how taxes interact with investment frictions. We consider the fact that reform not only reduced the after-tax price of capital by around 15%, but also reduced the price gap between new and used capital, which is one of the key frictions that generate lumpy investment.
Using corporate tax data and a difference-in-difference research strategy, we find that firms affected by the 2009 VAT reform increased investment by 36%, relative to firms that were not affected by the reform. More strikingly, this increase was primarily driven by extensive margin responses of firms that jump from not investing at all to replacing more than 20% of their current capital.
We then study how firms respond to tax incentives using a dynamic investment model that captures the Chinese tax setting. This model shows that policies that directly reduce investment frictions are more effective at stimulating investment than policies that only reduce the cost of investment. This lesson from China’s 2009 VAT reform is applicable to the administration of the VAT system in other countries, and to countries with other related fiscal policies, such as input taxes and investment tax credits.
China’s 2009 VAT reform reduced the price gap between new and used capital
China relied on a production-based VAT system prior to 2004. While firms were allowed to deduct input taxes on materials, they could not receive credits for equipment or other fixed assets. Given the 17% primary VAT rate, a firm purchasing 1000 RMB of equipment would pay 1170 RMB in total. On the other hand, when a firm sold used equipment, which was purchased at the VAT-included price, the firm was unable to recover the additional VAT. This practice created a gap between the price of new and used equipment, which is known as “partial irreversibility” (e.g., Cooper and Haltiwanger 2006). Partial irreversibility affects investment decisions. In particular, unless firms receive sufficiently high or sufficiently low productivity shocks, they may prefer not to adjust their capital level. Consistent with this friction, our data shows that almost half of firms do not invest in a given year.
The Chinese government launched a series of pilot programs to allow firms to deduct input VAT on equipment. While these programs started in 2004 in Northeast China (e.g., Cai and Harrison 2018), the reform was unexpectedly extended to the whole country in response to the 2008 financial crisis. This policy shock created distinct consequences for two groups of firms: domestic (Chinese) firms and foreign (non-Chinese) firms because foreign firms had been allowed to deduct input VAT on equipment even before the reform. Therefore, while the 2009 VAT reform did not affect investment in foreign firms, it substantially reduced investment costs for domestic firms. We exploit this natural experiment by using foreign firms as the control group and domestic firms as the treatment group in our empirical analysis.
Investment increased by 36%, driven by investment spikes
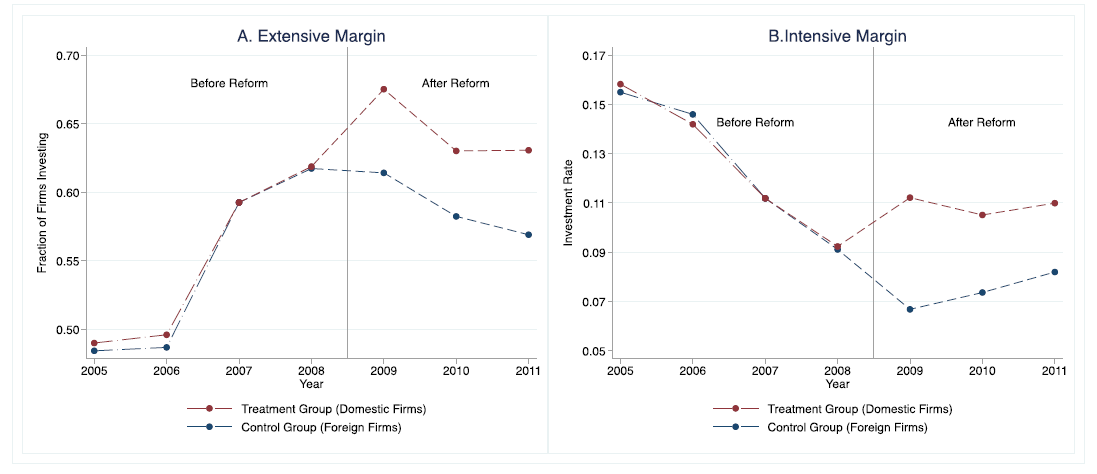
In comparing the investment of domestic and foreign firms before and after the reform, we find that the VAT reform significantly increased the investment by domestic firms at both the extensive and intensive margins. We first consider the extensive margin—whether a firm invests or not. Panel A of Figure 2 plots the fraction of domestic firms (red line) and foreign firms (blue line) investing in any given year. The two lines track each other well before the reform. After 2009, however, the fraction of domestic firms with positive investment increases by around 5 percentage points, or 10% relative to the 50% average rate. We then consider the intensive margin, the average investment-to-capital ratio. Panel B shows that, compared to foreign firms, the investment rate of domestic firms increased by about 3.6 percentage points, a 36% increase relative to an average investment rate of 10%.
Figure 2 Effects of 2009 China’s VAT Reform
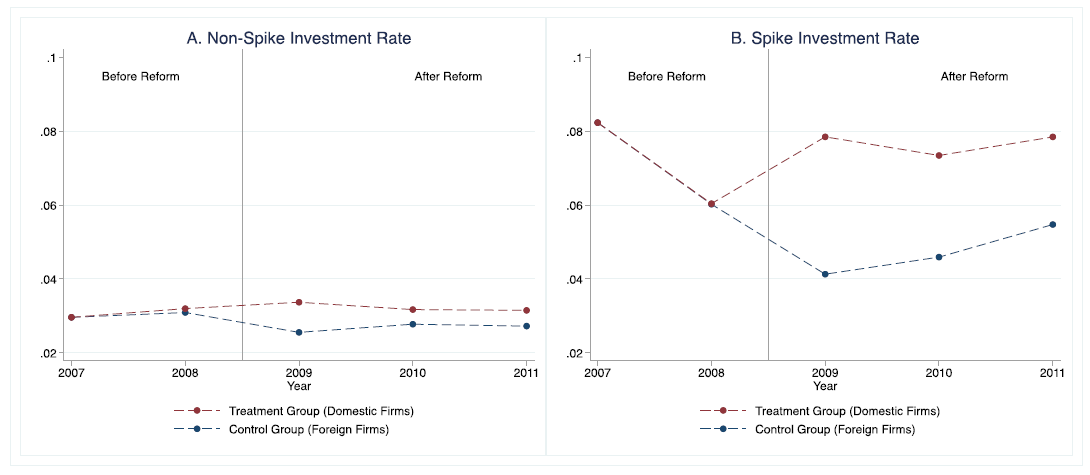
The increase in investment was driven by investment spikes, i.e., by investment rates greater than 20%. We show this by decomposing the investment response into two categories: (1) investment rate smaller than 20% (non-spike investment rate), and (2) investment rate greater than 20% (spike investment rate). Panel A of Figure 3 plots the average non-spike investment rate of domestic and foreign firms. The reform had a limited effect on the non-spike investment rate. In contrast, the reform increased the spike investment rate by 3.5 percentage points for domestic firms, which is more than 10 times the effect on the non-spike investment rate. Comparing the spike investment rate to the total effect, we find that 90% of the total effect is accounted for by an increase in investment spikes. This result shows that beyond lowering the price of capital, the reform stimulated investment spikes by narrowing the price gap between new and used capital.
Figure 3 Decomposing the Effects to Spike and Non-Spike Investment
Simulating alternative policies
Motivated by the lumpy investment response at the extensive margin, we estimate a dynamic investment model with various adjustment frictions and tax instruments. This model quantifies how tax policies interact with investment frictions and is able to replicate the reduced-form effects of the reform.
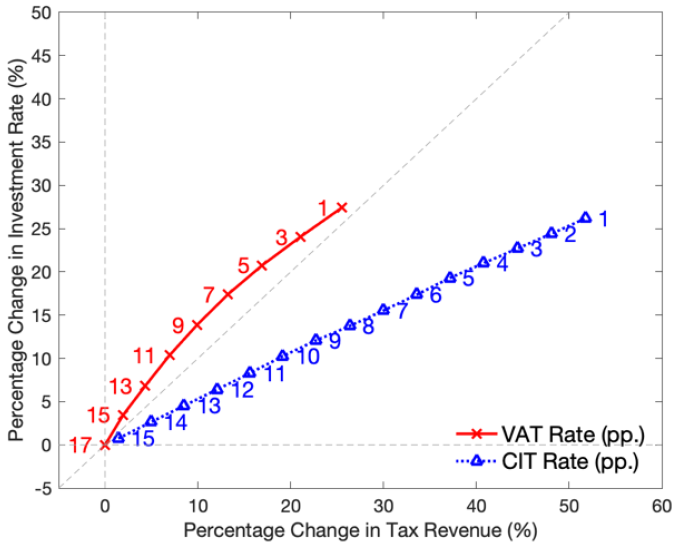
Through the lens of the model, we evaluate how much investment could be stimulated for a given tax expenditure using different incentives. Figure 4 compares the results of different policy simulations over a 10-year window by plotting the increase in investment in the Y-axis and the fiscal policy cost in the X-axis. For instance, the model suggests that lowering the effect of the VAT rate on equipment from 17% to 9% leads to a 15% investment increase, at the expense of a 12% tax revenue loss. The revenue loss is small because part of the VAT revenue loss is offset by an increase in corporate income tax (CIT) revenue. The figure also indicates that reducing the CIT rate from 15.4% to 13% leads to a similar tax revenue loss. The corresponding investment response, however, is less than 5%—around one-third of investment increase from the VAT stimulus. Indeed, the blue line for CIT cuts lies below the red line for the VAT, indicating the latter is more effective at stimulating investment at any given tax expenditure. Because the VAT reform increased the probability of firms investing by narrowing the price gap between new and used capital, this was a more effective reform than a potential CIT cut. We also find that other tax policies that reduce partial irreversibility—such as an investment tax credit—are similarly cost-effective.
Based on the empirical evidence from China’s VAT reform and the model simulation, we conclude that it is crucial to take into account investment frictions when evaluating the effectiveness of tax policies. We find that policies that reduce the importance of investment frictions are more effective at stimulating investment than policies that only lower the cost of capital.
(Zhao Chen, Fudan University; Xian Jiang is a Ph.D. candidate of Economics at Duke University; Zhikuo Liu, Shanghai University of Finance and Economics; Juan Carlos Suárez Serrato, Duke University; Daniel Yi Xu, Duke University.)
References
Cai, Jing, and Ann Harrison. 2019. “Industrial Policy in China: Some Intended or Unintended Consequences?” Industrial and Labor Relations Review. https://doi.org/10.1177/0019793919889609
Chen, Zhao, Xian Jiang, Zhikuo Liu, Juan Carlos Suarez Serrato, and Daniel Xu. 2019. “Tax Policy and Lumpy Investment Behavior: Evidence from China’s VAT Reform.” National Bureau of Economic Research Working Paper No. 26336. https://www.nber.org/papers/w26336
Cooper, Russell W., and John C. Haltiwanger. 2006. “On the Nature of Capital Adjustment Costs.” The Review of Economic Studies 73 (3): 611–33. https://doi.org/10.1111/j.1467-937X.2006.00389.x
Liu, Yongzheng, and Jie Mao. “How Do Tax Incentives Affect Investment and Productivity? Firm-Level Evidence from China.” 2019. American Economic Journal: Economic Policy 11 (3): 261–91. https://doi.org/10.1257/pol.20170478

Latest
Most Popular
- VoxChina Covid-19 Forum (Second Edition): China’s Post-Lockdown Economic Recovery VoxChina, Apr 18, 2020
- China’s Great Housing Boom Kaiji Chen, Yi Wen, Oct 11, 2017
- China’s Joint Venture Policy and the International Transfer of Technology Kun Jiang, Wolfgang Keller, Larry D. Qiu, William Ridley, Feb 06, 2019
- The Dark Side of the Chinese Fiscal Stimulus: Evidence from Local Government Debt Yi Huang, Marco Pagano, Ugo Panizza, Jun 28, 2017
- Wealth Redistribution in the Chinese Stock Market: the Role of Bubbles and Crashes Li An, Jiangze Bian, Dong Lou, Donghui Shi, Jul 01, 2020
- Evaluating Risk across Chinese Housing Markets Yongheng Deng, Joseph Gyourko, Jing Wu, Aug 02, 2017
- What Is Special about China’s Housing Boom? Edward L. Glaeser, Wei Huang, Yueran Ma, Andrei Shleifer, Jun 20, 2017
- Privatization and Productivity in China Yuyu Chen, Mitsuru Igami, Masayuki Sawada, Mo Xiao, Jan 31, 2018
- Daily Price Limits and the Magnet Effect Ting Chen, Zhenyu Gao, Jibao He, Wenxi Jiang, Wei Xiong, Oct 25, 2017
- How did China Move Up the Global Value Chains? Hiau Looi Kee, Heiwai Tang, Aug 30, 2017


