A Bridge on Economic Issues between China and the World


 Facebook
  Twitter
  Instagram
 WeChat
  Email
Email China’s High Savings: Drivers, Prospects, and Policies

China’s high national savings rate—one of the highest in the world—is at
the heart of its external/internal imbalances. High savings finance
elevated investment when held domestically, and lead to external
imbalances when they flow abroad. Today, China’s higher savings,
compared to the global average, mostly emanate from the household
sector, due to demographic changes induced by the 1979 one-child policy
and the reshaping of the social safety net in the 1990s. Housing reform
and rising income inequality also contribute to higher household
savings. Moving forward, rapid ageing will put downward pressure on
savings. Still, policy efforts to strengthen the social safety net and
reduce income inequality are needed to reduce savings further and boost
consumption.
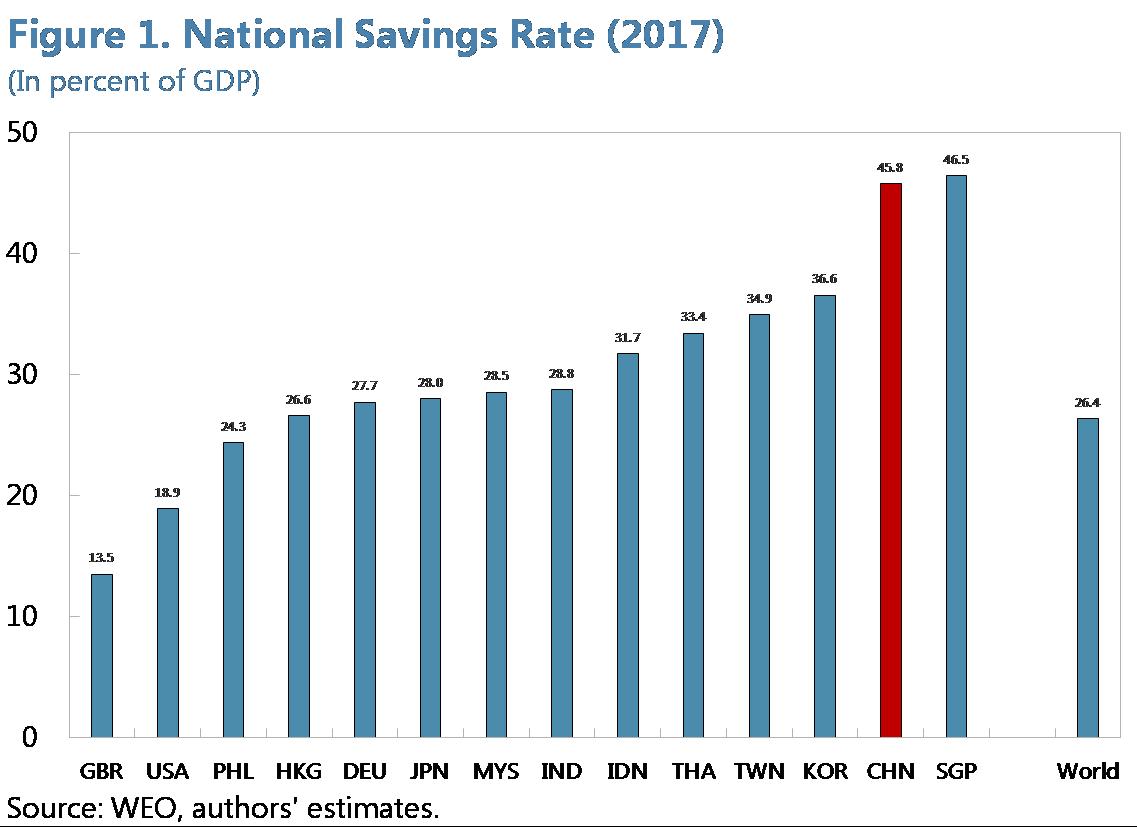
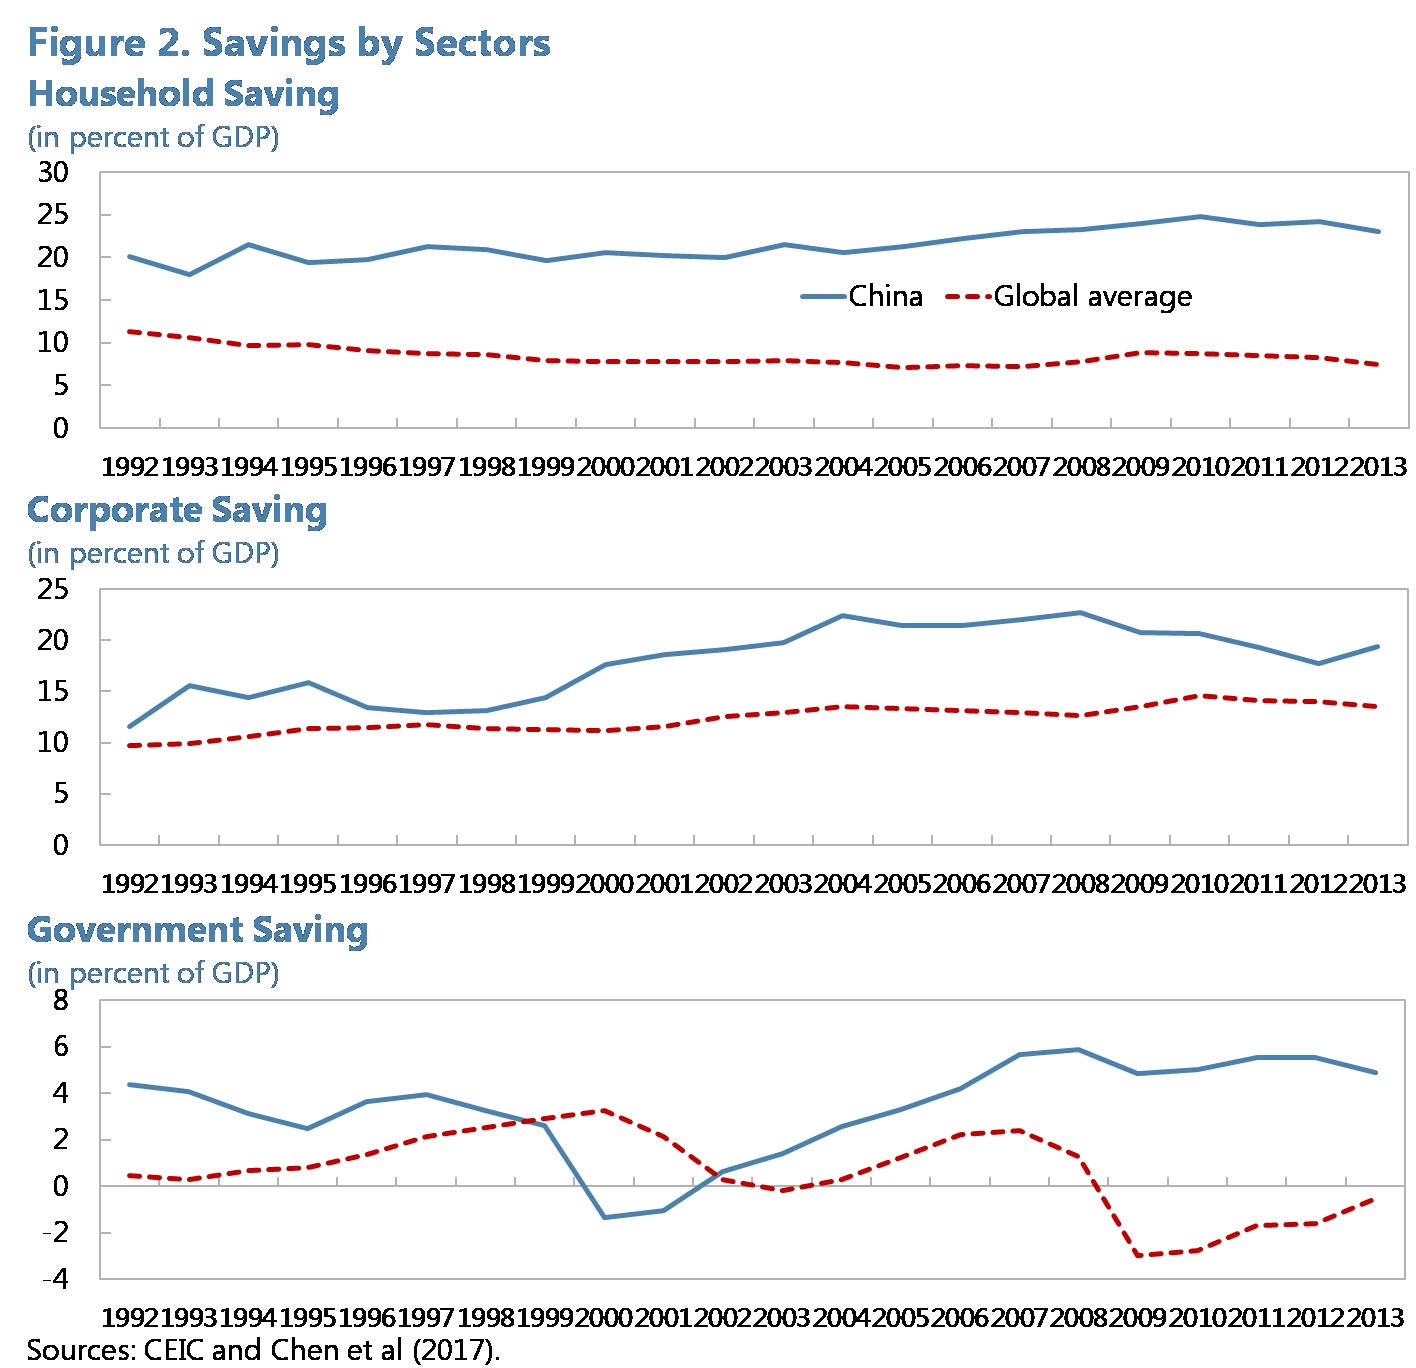
China has one of the highest savings rates in the world. After the country’s entry into the World Trade Organization (WTO) in 2001, its national savings as a share of GDP rose steadily to a peak of 52 percent of GDP in 2008, before gradually declining to 46 percent by 2017. Despite this moderation, China still stands out compared to the global average of 20 percent (15 percent for emerging market economies, see Figure 1). In terms of composition, the household sector has become the main driver of higher savings in China. In 2013, household savings accounted for 23 percent of GDP, compared to the global average of 8 percent. (see Figure 2).
What drives China’s high savings? One strand of the literature focuses on demographic factors, arguing that the changing demographic structure and gender imbalances resulting from the one-child policy led to high household savings (Choukhmane et al., 2014; Curtis, Lugauer and Mark, 2015; and Wei and Zhang, 2011). Another strand focuses on the role of precautionary savings, asserting that the transformation of the social safety net and job security during China’s transition from a centrally-planned economy to a market economy was the main contributor to the increase in savings (Chamon and Prasad, 2010; and He et al., 2018). There are also studies on the impact of housing prices and housing ownership on savings, which found mixed evidence.
In a recently published IMF working paper (Zhang et al. (2018), IMF Working Paper 18/277), we provide a comprehensive study of the drivers of China’s high savings. We employ both model simulations and empirical analyses, including cross-country microdata, to examine income inequality and savings, an area that has not been thoroughly studied in the literature. Overall, our analysis suggests that rising household savings have largely been a result of demographic changes. Rising income inequality, the transformation of the social safety net, and housing market development also played a role.
Household Savings
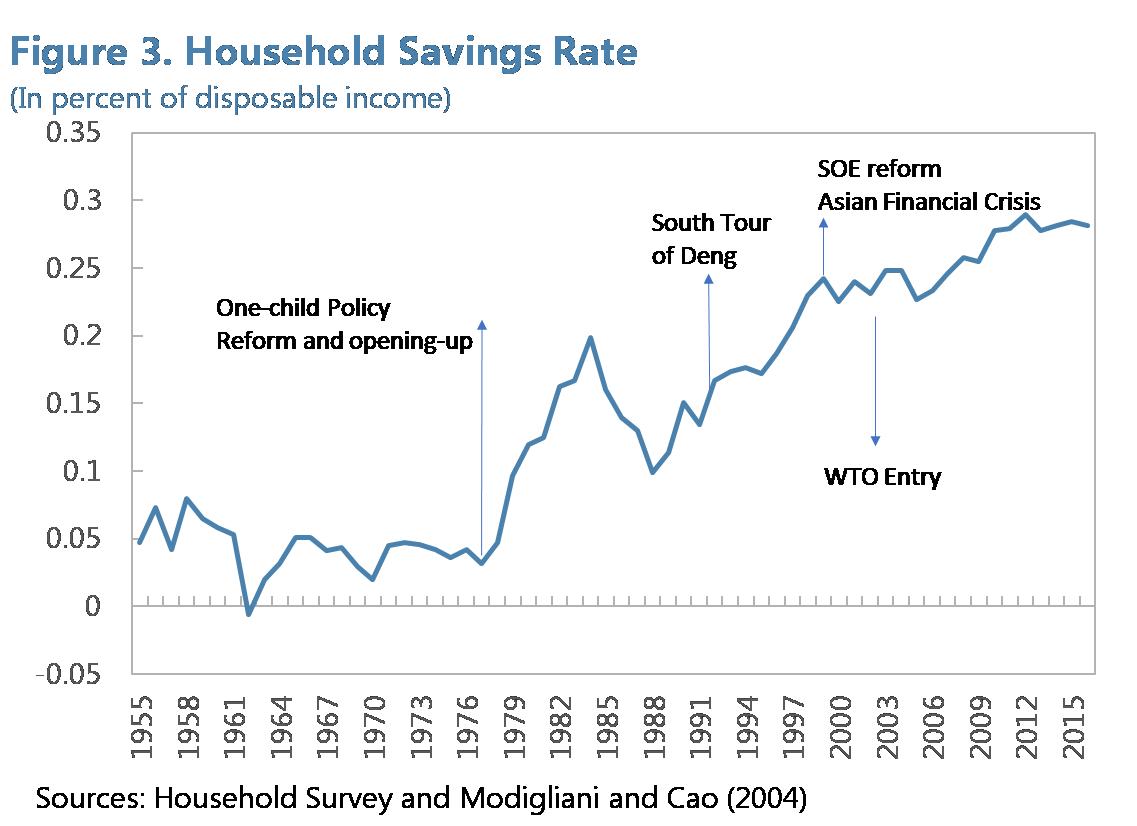
The rise in China’s household savings since the late 1970s took place in three phases (See Figure 3). The first phase was in the 1980s, following the introduction of the one-child policy, with the savings rate rising from 5 percent of disposable income to 20 percent. The second phase was in the 1990s. After Deng Xiaoping’s southern tour reaffirmed China’s reform and opening up policy, SOE reforms took center stage and was accompanied by a fundamental transformation of the social safety net and job security. The household savings rate rose to 25 percent during this period. The third phase came after China’s WTO entry in 2001, and the savings rate rose further to 30 percent. Notably, since 2012, household savings seem to have plateaued.
Demographic changes. We first investigate the impact of demographics on household savings using the overlapping generations model developed by Curtis et al. (2015). The model is calibrated to the Chinese economy and matches several key ratios on survival probabilities, birth rates, and family transfers. The model captures both the expenditure and the transfer channels by including children’s consumption in the parents’ utility function as well as transfers from children to parents. On the expenditure side, having fewer children requires less spending, which contributes to an increase in savings. On the income/transfer side, having fewer children leads to a decline in transfers from adult children to elderly parents, which again contributes to an increase in savings. Model simulations show that demographics alone can explain about half of the increase in China’s household savings rate, controlling for income growth and interest rates. By adding the observed dynamics of income and interest rates, the full model can broadly explain the trends in China’s household savings. However, the model cannot explain the spikes in the savings rate in the 1980s and the 1990s, during which period the transformation of the social safety net may have played an important role in the rise of precautionary savings.
Social safety net. Our analysis finds that higher social spending is significantly associated with lower household savings, with differing impacts in urban and rural areas. Using a cross-sectional analysis for the 287 prefectural municipalities, we find a significant positive relationship between social spending and urban and rural consumption, with social security spending having a stronger relationship with consumption than other types of social spending in urban areas, while government spending on health care is found to be the most effective in boosting consumption in rural areas.
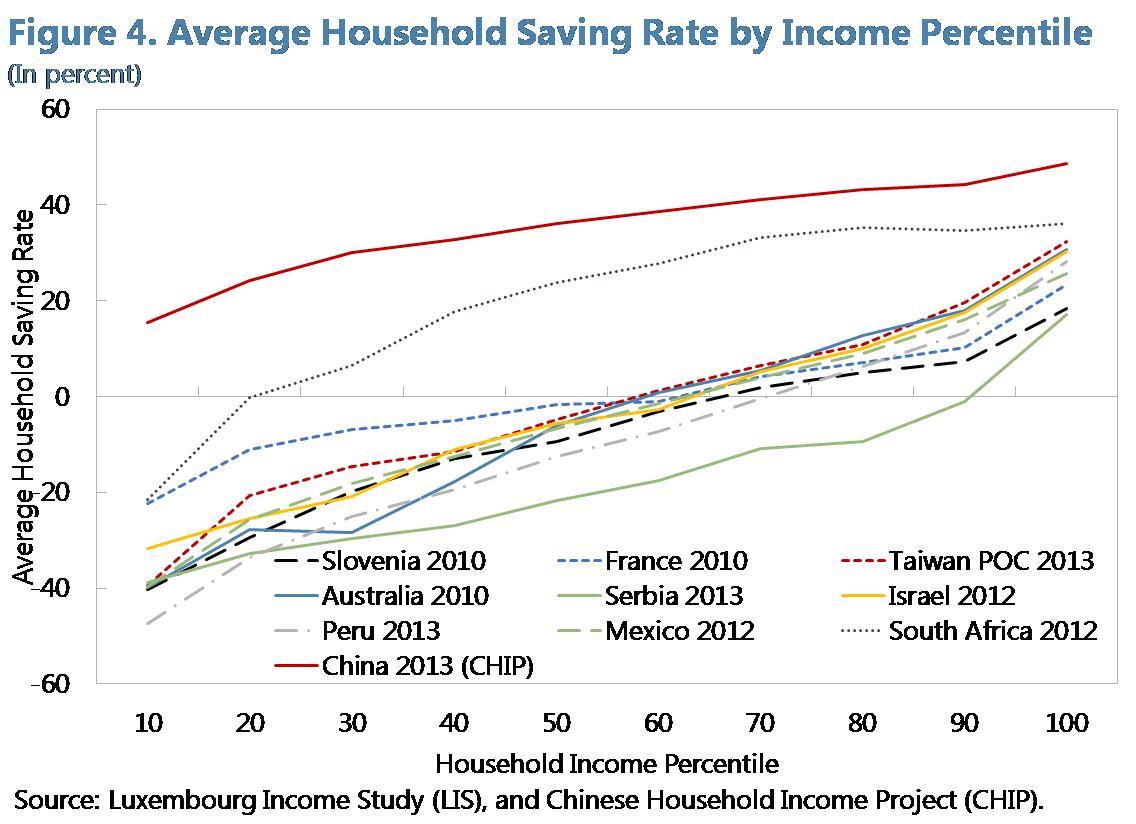
Income inequality. Increased income inequality in China is also a potential driver for rising household savings. Household-level microdata (in 2013) suggest that the savings behavior differs substantially across income deciles: top earners saved close to 50 percent of their income, while the bottom decile saved only 20 percent. Income inequality thus translates into savings inequality. Interestingly, while China’s household savings rate is higher at every income decile compared to other countries, the gap is particularly large for the poorest (see Figure 4). In many countries, the savings rates for the bottom 10–20 percentiles are negative, indicating that substantial social transfers are available for basic consumption. In China, however, the savings rate for the poor is positive at around 20 percent. This points to inadequate social transfers, a lack of progressivity in taxation, and a limited social safety net.
Housing. Finally, we study the relationship between housing and household savings. The housing market could affect savings behavior through various channels, including the down payment effect, the mortgage effect, and the wealth effect. The down payment channel implies that a tenant would save more if she decides to buy a house, and rising housing prices would make that incentive even stronger. The mortgage channel suggests that homeowners would need to save more to pay mortgages. The wealth effect implies that, with rising housing prices, homeowners would increase consumption and reduce saving. The overall impact of housing ownership on savings, interacted with rapidly rising housing prices, depends on the relative strength of these offsetting channels. Our empirical study based on Chinese Household Income Project (CHIP) data shows that China’s rising homeownership increased the savings rate significantly by 3 percentage points during the first ten years of the 2000s, with the mortgage effect dominating other factors. However, this effect dissipated by 2013, likely reflecting the growing wealth effect as house prices rose substantially nationwide.
Corporate Savings
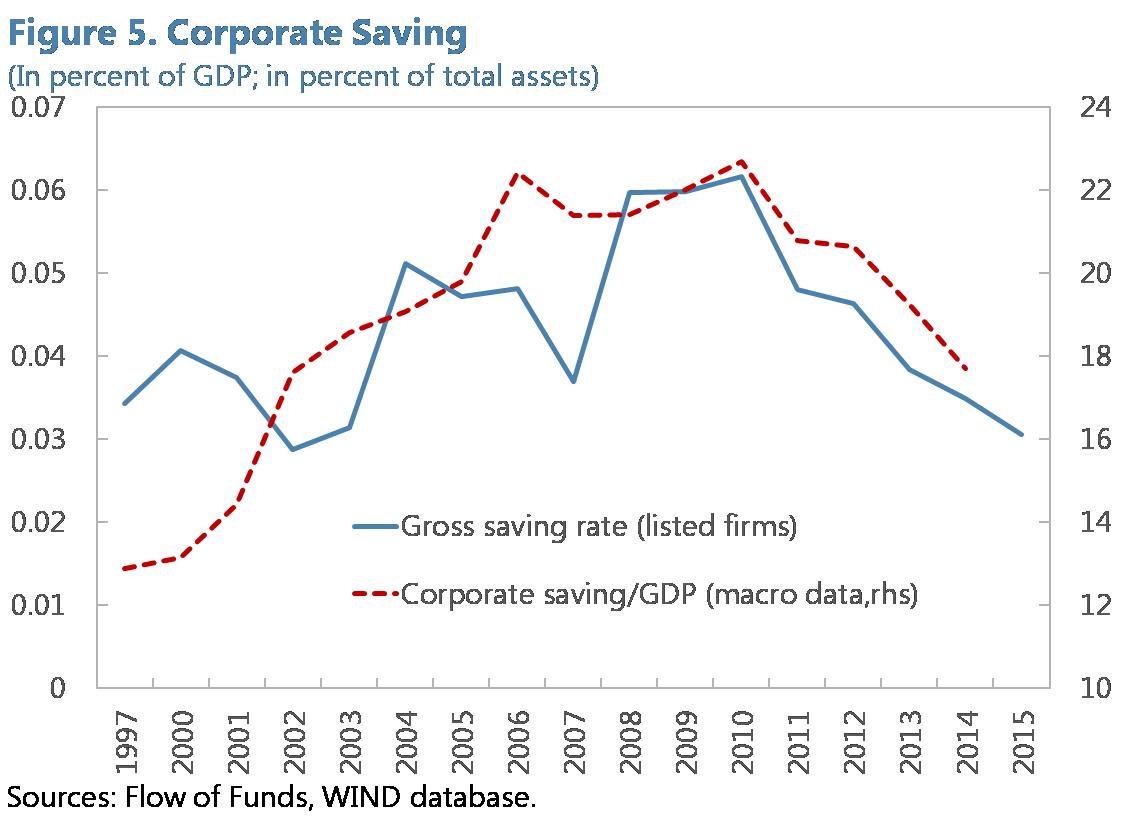
China’s corporate savings surged in the early 2000s, partly due to an undervalued exchange rate. Since the global financial crisis, corporate savings have moderated while China’s exchange rate gradually adjusted to the level in line with economic fundamentals (see Figure 5). The net savings rate (gross savings minus investment as a ratio to assets) was negative throughout the last decade, reflecting high investment in China. As a result, the corporate sector does not appear to be a driver of China’s current account surplus. This stands in contrast with some other eastern Asian countries, where firms’ net savings are large and positive, and hence, the main contributors to external imbalances.
Our firm level analysis indicates that China’s corporate savings ratio, in both gross and net terms, is comparable to those of the rest of the world. Moreover, SOEs in China have lower gross savings, but higher net savings compared to private firms, reflecting SOEs’ relatively low operating efficiency as well as low investment ratios. The firm-level evidence illustrates the need for more decisive SOE reforms and policies that encourage larger transfers of SOE dividends to the budget. This would reduce SOE savings and help support government spending for strengthening the social safety net.
Government Savings
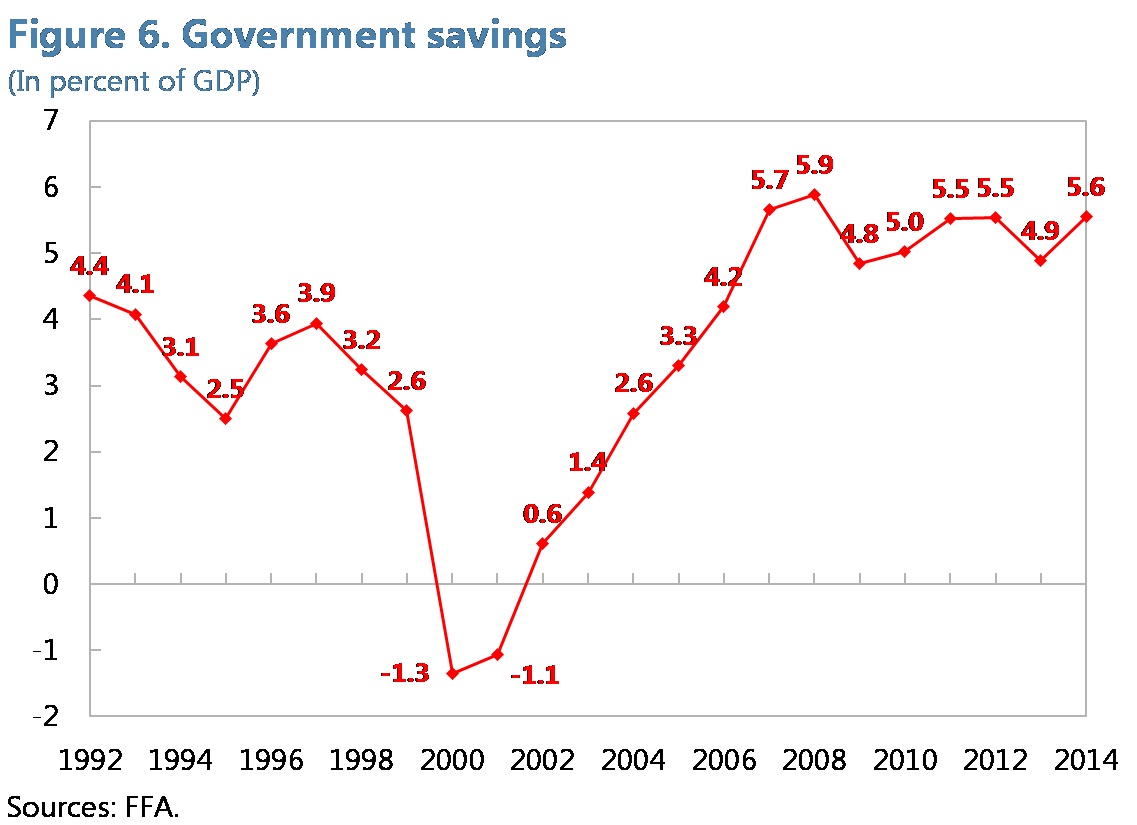
China’s government savings rate has stabilized since 2008 at around 5 percent of GDP and remained the highest among the major economies (see Figure 6). This reflects China’s relatively low government consumption, as its revenue (as a share of GDP) is broadly in line with that of other major economies, though below the OECD average.
The relatively low government consumption in China is mainly driven by the government’s stronger focus on public investment than on public service, low social spending, and an underdeveloped social security system. China’s social security system is still at an early stage compared to those of most advanced economies, reflecting a relatively low old-age dependence ratio. However, predicted rapid aging will put significant pressure on pension spending.
Prospects and Policy Recommendations
Going forward, structural forces (e.g., rapid aging) and the envisaged policy support (such as increasing social spending) should lead to a continued decline in household and government savings, while corporate savings are also likely to fall with lower capital returns and rising labor income shares. Overall, we project the national savings-to-GDP ratio to decline by 4.5 percentage points by 2022, and by close to 10 percentage points by 2030.
In a more proactive reform scenario, with a quicker increase in social spending and reduction in income inequality, the savings rate could decline by an extra 2 percent of GDP by 2022. This can be achieved by a suite of policy measures including:
• Making the tax system more progressive (more reliance on personal income tax and wealth taxes);
• Increasing social transfers to poor households;
• Increasing expenditure on health care, pensions, and education;
• Financing higher social spending needs through larger dividend payments and/or asset transfers from SOEs; and
• Improving access to formal financing of private firms.
Chamon, M. D., and E. Prasad (2010). “Why are Saving Rates of Urban Households in China Rising?” American Economic Journal: Macroeconomics, vol. 2(1), pp. 93-130. https://www.aeaweb.org/articles?id=10.1257/mac.2.1.93
Choukhmane, T., Coeurdacier, N. and K. Jin (2014). “The One-Child Policy
and Household Savings,” Working Paper. https://economics.yale.edu/sites/default/files/tahamaclunch100214_2.pdf
Curtis, C. C., Lugauer, S. and N. C. Mark (2015). “Demographic Patterns and Household Saving in China,” American Economic Journal: Macroeconomics, vol. 7(2), pp. 58–94. https://pubs.aeaweb.org/doi/pdfplus/10.1257/mac.20130105
He, H, Huang, F., Liu, Z. and D. Zhu (2018). “Breaking the ‘Iron Rice Bowl:’ Evidence of Precautionary Savings from the Chinese State-Owned Enterprises Reform,” Journal of Monetary Economics, vol. 94, pp. 94-113. https://doi.org/10.1016/j.jmoneco.2017.12.002
Wei, S-J., and X. Zhang (2011). “The Competitive Saving Motive: Evidence from Rising Sex Ratios and Savings Rates in China,” Journal of Political Economy, vol. 119, pp. 511-564. http://www.jstor.org/stable/10.1086/660887
China has one of the highest savings rates in the world. After the country’s entry into the World Trade Organization (WTO) in 2001, its national savings as a share of GDP rose steadily to a peak of 52 percent of GDP in 2008, before gradually declining to 46 percent by 2017. Despite this moderation, China still stands out compared to the global average of 20 percent (15 percent for emerging market economies, see Figure 1). In terms of composition, the household sector has become the main driver of higher savings in China. In 2013, household savings accounted for 23 percent of GDP, compared to the global average of 8 percent. (see Figure 2).
In a recently published IMF working paper (Zhang et al. (2018), IMF Working Paper 18/277), we provide a comprehensive study of the drivers of China’s high savings. We employ both model simulations and empirical analyses, including cross-country microdata, to examine income inequality and savings, an area that has not been thoroughly studied in the literature. Overall, our analysis suggests that rising household savings have largely been a result of demographic changes. Rising income inequality, the transformation of the social safety net, and housing market development also played a role.
Household Savings
The rise in China’s household savings since the late 1970s took place in three phases (See Figure 3). The first phase was in the 1980s, following the introduction of the one-child policy, with the savings rate rising from 5 percent of disposable income to 20 percent. The second phase was in the 1990s. After Deng Xiaoping’s southern tour reaffirmed China’s reform and opening up policy, SOE reforms took center stage and was accompanied by a fundamental transformation of the social safety net and job security. The household savings rate rose to 25 percent during this period. The third phase came after China’s WTO entry in 2001, and the savings rate rose further to 30 percent. Notably, since 2012, household savings seem to have plateaued.
Social safety net. Our analysis finds that higher social spending is significantly associated with lower household savings, with differing impacts in urban and rural areas. Using a cross-sectional analysis for the 287 prefectural municipalities, we find a significant positive relationship between social spending and urban and rural consumption, with social security spending having a stronger relationship with consumption than other types of social spending in urban areas, while government spending on health care is found to be the most effective in boosting consumption in rural areas.
Income inequality. Increased income inequality in China is also a potential driver for rising household savings. Household-level microdata (in 2013) suggest that the savings behavior differs substantially across income deciles: top earners saved close to 50 percent of their income, while the bottom decile saved only 20 percent. Income inequality thus translates into savings inequality. Interestingly, while China’s household savings rate is higher at every income decile compared to other countries, the gap is particularly large for the poorest (see Figure 4). In many countries, the savings rates for the bottom 10–20 percentiles are negative, indicating that substantial social transfers are available for basic consumption. In China, however, the savings rate for the poor is positive at around 20 percent. This points to inadequate social transfers, a lack of progressivity in taxation, and a limited social safety net.
Corporate Savings
China’s corporate savings surged in the early 2000s, partly due to an undervalued exchange rate. Since the global financial crisis, corporate savings have moderated while China’s exchange rate gradually adjusted to the level in line with economic fundamentals (see Figure 5). The net savings rate (gross savings minus investment as a ratio to assets) was negative throughout the last decade, reflecting high investment in China. As a result, the corporate sector does not appear to be a driver of China’s current account surplus. This stands in contrast with some other eastern Asian countries, where firms’ net savings are large and positive, and hence, the main contributors to external imbalances.
Government Savings
China’s government savings rate has stabilized since 2008 at around 5 percent of GDP and remained the highest among the major economies (see Figure 6). This reflects China’s relatively low government consumption, as its revenue (as a share of GDP) is broadly in line with that of other major economies, though below the OECD average.
Prospects and Policy Recommendations
Going forward, structural forces (e.g., rapid aging) and the envisaged policy support (such as increasing social spending) should lead to a continued decline in household and government savings, while corporate savings are also likely to fall with lower capital returns and rising labor income shares. Overall, we project the national savings-to-GDP ratio to decline by 4.5 percentage points by 2022, and by close to 10 percentage points by 2030.
In a more proactive reform scenario, with a quicker increase in social spending and reduction in income inequality, the savings rate could decline by an extra 2 percent of GDP by 2022. This can be achieved by a suite of policy measures including:
• Making the tax system more progressive (more reliance on personal income tax and wealth taxes);
• Increasing social transfers to poor households;
• Increasing expenditure on health care, pensions, and education;
• Financing higher social spending needs through larger dividend payments and/or asset transfers from SOEs; and
• Improving access to formal financing of private firms.
(Longmei Zhang, Ding Ding, Hui He, and Rui C. Mano, the International Monetary Fund.)
References
Chamon, M. D., and E. Prasad (2010). “Why are Saving Rates of Urban Households in China Rising?” American Economic Journal: Macroeconomics, vol. 2(1), pp. 93-130. https://www.aeaweb.org/articles?id=10.1257/mac.2.1.93
Choukhmane, T., Coeurdacier, N. and K. Jin (2014). “The One-Child Policy
and Household Savings,” Working Paper. https://economics.yale.edu/sites/default/files/tahamaclunch100214_2.pdf
Curtis, C. C., Lugauer, S. and N. C. Mark (2015). “Demographic Patterns and Household Saving in China,” American Economic Journal: Macroeconomics, vol. 7(2), pp. 58–94. https://pubs.aeaweb.org/doi/pdfplus/10.1257/mac.20130105
He, H, Huang, F., Liu, Z. and D. Zhu (2018). “Breaking the ‘Iron Rice Bowl:’ Evidence of Precautionary Savings from the Chinese State-Owned Enterprises Reform,” Journal of Monetary Economics, vol. 94, pp. 94-113. https://doi.org/10.1016/j.jmoneco.2017.12.002
Wei, S-J., and X. Zhang (2011). “The Competitive Saving Motive: Evidence from Rising Sex Ratios and Savings Rates in China,” Journal of Political Economy, vol. 119, pp. 511-564. http://www.jstor.org/stable/10.1086/660887
Zhang, L., Brooks, R., Ding, D., Ding, H., Lu, J., He, H., and R. Mano (2018). “China’s High Savings: Drivers, Prospects, and Policies,” IMF Working Paper 18/277. https://www.imf.org/~/media/Files/Publications/WP/2018/wp18277.ashx

Latest
Most Popular
- VoxChina Covid-19 Forum (Second Edition): China’s Post-Lockdown Economic Recovery VoxChina, Apr 18, 2020
- China’s Great Housing Boom Kaiji Chen, Yi Wen, Oct 11, 2017
- China’s Joint Venture Policy and the International Transfer of Technology Kun Jiang, Wolfgang Keller, Larry D. Qiu, William Ridley, Feb 06, 2019
- The Dark Side of the Chinese Fiscal Stimulus: Evidence from Local Government Debt Yi Huang, Marco Pagano, Ugo Panizza, Jun 28, 2017
- Wealth Redistribution in the Chinese Stock Market: the Role of Bubbles and Crashes Li An, Jiangze Bian, Dong Lou, Donghui Shi, Jul 01, 2020
- Evaluating Risk across Chinese Housing Markets Yongheng Deng, Joseph Gyourko, Jing Wu, Aug 02, 2017
- What Is Special about China’s Housing Boom? Edward L. Glaeser, Wei Huang, Yueran Ma, Andrei Shleifer, Jun 20, 2017
- Privatization and Productivity in China Yuyu Chen, Mitsuru Igami, Masayuki Sawada, Mo Xiao, Jan 31, 2018
- How did China Move Up the Global Value Chains? Hiau Looi Kee, Heiwai Tang, Aug 30, 2017
- Daily Price Limits and the Magnet Effect Ting Chen, Zhenyu Gao, Jibao He, Wenxi Jiang, Wei Xiong, Oct 25, 2017


