A Bridge on Economic Issues between China and the World


 Facebook
  Twitter
  Instagram
 WeChat
  Email
Email China’s Overwhelming Contribution to Scientific Publications

That China, one of the lowest income
countries in the world at the turn of the 21st century, became a
super-power in scientific knowledge in less than two decades is a
remarkable development in the history of science. The way China deploys
its newly developed scientific resources will drive the direction of
science and technology into the foreseeable future and the direction of
our increasingly knowledge-based economy.
From 2000 to 2016, China jumped from bit player to star performer in physical science and engineering (S&E) research. As Xie, Zhang and Lai (2014) document, China invested heavily in S&E in the 2000s, becoming a world leader in bachelor’s and master’s degrees and a huge producer of S&E PhDs and became the biggest source of international students, who earn S&E PhDs in the US and other advanced countries. It also increased its R&D and number of researchers hugely. The country’s R&D spending exceeded EU spending and should surpass US spending by 2020 at the latest.
The investment in scientific resources paid off in a huge rise in China’s share of scientific papers and citations in the Scopus database that indexes global scientific publications. In 2000, Chinese addresses accounted for 4% of papers and less than 2% of citations. China topped the US in number of papers published in 2016, generating headlines (Tolleson, 2018). Impressive as these statistics are, our research (Xie and Freeman, 2018) shows that they massively understate China’s contribution to global science in two ways.
First, measures of scientific contribution by the address of researchers gives China no credit for papers written by Chinese researchers with non-Chinese addresses. It counts a paper with, say, five Chinese named authors working in the US as a US paper just as it would a paper with five authors having American names. The missing contribution is large, as China’s diaspora research community is such that in 2016 17% of non-China addressed articles had at least one Chinese named author.
To take account of Chinese researchers working outside China, we modify the standard address-based measure of contribution with an address-and-names metric that gives ½ credit for China’s share of addresses and ½ credit for Chinese share of names on a paper. We distinguish persons from China by first names as well as surnames, counting Xu Wang as from China but not David Wang. Since nearly all names on China addressed papers are Chinese, while many non-Chinese addresses have a Chinese named author, the adjustment increases China’s share of papers. It raises China’s share in 2016 by nearly one third, from 18.0% of papers in the weighted address measure to 23.3% of papers in the address-and-names measure.
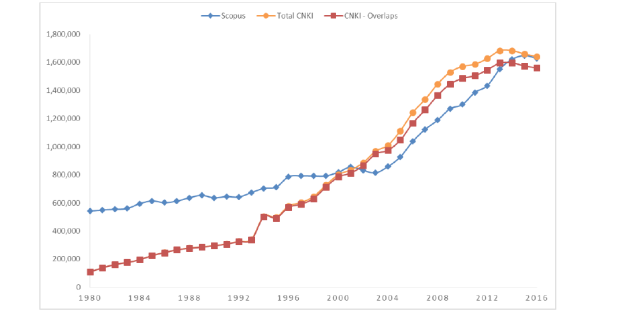
Second, while Scopus includes some Chinese journals in its bibliometry, over 80% of its journals are in English, and it covers only 8% of the 4,216 science, engineering, and math journals that the China National Knowledge Infrastructure (CNKI) reports as published in China. Scopus presumably chose outstanding Chinese journals for inclusion, but the journals excluded from its database almost certainly contain some useful and interesting science. In any case, the magnitude of the missing scientific papers is huge. As Figure 1 shows, CNKI journals published approximately the same number of articles (1.6 million) in 2016 as Scopus – the results of a huge increase in CNKI publications beginning in the 1980s.
If the scientific content/impact of Chinese language papers was on a par with that of English or other language papers in Scopus, the roughly equal number of CNKI and Scopus articles would imply that China was responsible for about 2/3rd’s of scientific work in 2016: ½ from CNKI journals and ~ 1/3 of the ½ from Scopus.
But CNKI articles do not have the same quality/impact as international journal articles. Fewer scientists read Chinese than English. CNKI papers are shorter and have fewer references than Scopus papers. China’s requirement that PhD’s and master’s candidates publish thesis papers for a degree leads to many publications with a narrow scope that would elsewhere place them in university libraries. Indicative of the quality difference, 44.6% of CNKI papers published in 2013 received no citations in the succeeding three years compared to 29.0% of Scopus papers published in 2013. Recognizing the higher impact/quality of English language publications, Chinese universities offer sizable incentives for publishing in English language journals, which induces researchers to send their best work overseas.
To take account of the missing Chinese scientific literature and obtain a valid estimate of China’s contribution to science worldwide, we need an “exchange rate” measure of comparability between publications in the two databases. How valuable is a CNKI article relative to a Scopus article in contributing to science?
We use citations to answer this question. While imperfect, citations are the most widely used and objective indicator of the quality/impact of an article. We focus on papers published in 2013, which allows at least three-year forward citations in our data. Both Scopus and the CNKI count citations within their own database. A 2013 Scopus journal article averaged 9.2 forward citations from other Scopus articles while a 2013 CNKI journal article averaged 2.3 forward citations from other CNKI articles. This suggests a citation-based exchange rate of about 0.25 (= 2.3/9.2) for CNKI articles compared to Scopus articles.
But this excludes citations across the databases, which neither database counts. To estimate cross-database citations, we drew random samples of 2000 non-Chinese language Scopus papers and of 500 Chinese language papers in CNKI from 2013 to 2017 and counted their references to 2013 publications. References are, by definition, backward citations from later papers to earlier papers, and thus the forward citations of earlier papers. CNKI papers are far more likely to cite Scopus articles than the reverse. About half of journal references in CNKI articles to 2013 publications were to Scopus articles, while just 0.29% of journal references in Scopus articles to 2013 publications were to CNKI Chinese language papers. Extrapolating, we estimate that 2013 Scopus articles received 3,276,350 citations from CNKI articles through 2017 whereas 2013 CNKI articles received l32,196 citations from non-Chinese language Scopus articles. Adding these citations to the number of citations in Scopus and CNKI reduces the exchange rate of a CNKI journal article from 0.25 to 0.20 of a Scopus paper. Valuing a CNKI publication at 1/5th of a Scopus publication we estimated the total number of Scopus equivalent papers in the two data sets and found that China contributed 36% of these articles.
Rising quality of Chinese scientific research
We explored further the quality of Chinese scientific articles in the Scopus database by analyzing the citations those papers received from other Scopus papers. In 2000, papers with all-Chinese addresses received just 29% of the world average of citations while international collaborations and papers with Chinese names working at non-Chinese addresses received more citations than the world average. The best research by Chinese scientists was being conducted outside of China. By 2013, citations to papers with all-China addresses increased to 70% of the global average while collaborative work and work done outside China converged toward the average. China’s share of global citations rose from 7.4% in 2000 to 19.5% in 2013, due primarily to the increased share of citations to all-China addressed papers.
As a final look at the quality of China’s contribution to science, we examined the percentage of Chinese names and Chinese addresses in papers published in Nature and Science. In 2016, about 20% of names on papers in these journals were Chinese while 8% to 9% of addresses were Chinese – far above 7-8% of names and 0.5% of addresses in 2000.
In total, we estimate that China obtained 37% of Scopus equivalent citations. With 18% of the world’s population and world GDP, China’s 36% of 2016 papers and 37% of 2013 citations show that it is essentially contributing twice its weight to the advance of science. While our calculations ignore scientific articles outside Scopus in languages other than Chinese, we estimate that taking account of these would lower our estimated China contribution by less than 3 to 4 percentage points.
Conclusion
That China, one of the lowest income countries in the world at the turn of the 21st century, became a super-power in scientific knowledge in less than two decades is a remarkable development in the history of science. The way China deploys its newly developed scientific resources will drive the direction of science and technology into the foreseeable future and the direction of our increasingly knowledge-based economy. In the 19th century, Horace Greeley famously advised Americans to “Go West, young man, and grow up with the country.” In the 21st century, science is going East and will grow up with China.
(Qingnan Xie, Nanjing University of Science &Technology & Labor and Worklife Program, Harvard Law School; Richard B. Freeman, Harvard & the NBER.)
Tollefson, Jeff (2018). “China Declared World’s Largest Producer of Scientific Articles,” Nature, News, 553 (25 January): 390. doi.org/10.1038/d41586-018-00927-4
Xie, Qingnan, and Richard B. Freeman (2018). “Bigger than You Thought: China’s Contribution to Scientific Publications,” NBER Working Paper 24829 (July).
From 2000 to 2016, China jumped from bit player to star performer in physical science and engineering (S&E) research. As Xie, Zhang and Lai (2014) document, China invested heavily in S&E in the 2000s, becoming a world leader in bachelor’s and master’s degrees and a huge producer of S&E PhDs and became the biggest source of international students, who earn S&E PhDs in the US and other advanced countries. It also increased its R&D and number of researchers hugely. The country’s R&D spending exceeded EU spending and should surpass US spending by 2020 at the latest.
The investment in scientific resources paid off in a huge rise in China’s share of scientific papers and citations in the Scopus database that indexes global scientific publications. In 2000, Chinese addresses accounted for 4% of papers and less than 2% of citations. China topped the US in number of papers published in 2016, generating headlines (Tolleson, 2018). Impressive as these statistics are, our research (Xie and Freeman, 2018) shows that they massively understate China’s contribution to global science in two ways.
First, measures of scientific contribution by the address of researchers gives China no credit for papers written by Chinese researchers with non-Chinese addresses. It counts a paper with, say, five Chinese named authors working in the US as a US paper just as it would a paper with five authors having American names. The missing contribution is large, as China’s diaspora research community is such that in 2016 17% of non-China addressed articles had at least one Chinese named author.
To take account of Chinese researchers working outside China, we modify the standard address-based measure of contribution with an address-and-names metric that gives ½ credit for China’s share of addresses and ½ credit for Chinese share of names on a paper. We distinguish persons from China by first names as well as surnames, counting Xu Wang as from China but not David Wang. Since nearly all names on China addressed papers are Chinese, while many non-Chinese addresses have a Chinese named author, the adjustment increases China’s share of papers. It raises China’s share in 2016 by nearly one third, from 18.0% of papers in the weighted address measure to 23.3% of papers in the address-and-names measure.
Second, while Scopus includes some Chinese journals in its bibliometry, over 80% of its journals are in English, and it covers only 8% of the 4,216 science, engineering, and math journals that the China National Knowledge Infrastructure (CNKI) reports as published in China. Scopus presumably chose outstanding Chinese journals for inclusion, but the journals excluded from its database almost certainly contain some useful and interesting science. In any case, the magnitude of the missing scientific papers is huge. As Figure 1 shows, CNKI journals published approximately the same number of articles (1.6 million) in 2016 as Scopus – the results of a huge increase in CNKI publications beginning in the 1980s.
Figure 1: Numbers of S&E Journal Articles in Scopus and in CNKI, 1980-2016.
If the scientific content/impact of Chinese language papers was on a par with that of English or other language papers in Scopus, the roughly equal number of CNKI and Scopus articles would imply that China was responsible for about 2/3rd’s of scientific work in 2016: ½ from CNKI journals and ~ 1/3 of the ½ from Scopus.
But CNKI articles do not have the same quality/impact as international journal articles. Fewer scientists read Chinese than English. CNKI papers are shorter and have fewer references than Scopus papers. China’s requirement that PhD’s and master’s candidates publish thesis papers for a degree leads to many publications with a narrow scope that would elsewhere place them in university libraries. Indicative of the quality difference, 44.6% of CNKI papers published in 2013 received no citations in the succeeding three years compared to 29.0% of Scopus papers published in 2013. Recognizing the higher impact/quality of English language publications, Chinese universities offer sizable incentives for publishing in English language journals, which induces researchers to send their best work overseas.
To take account of the missing Chinese scientific literature and obtain a valid estimate of China’s contribution to science worldwide, we need an “exchange rate” measure of comparability between publications in the two databases. How valuable is a CNKI article relative to a Scopus article in contributing to science?
We use citations to answer this question. While imperfect, citations are the most widely used and objective indicator of the quality/impact of an article. We focus on papers published in 2013, which allows at least three-year forward citations in our data. Both Scopus and the CNKI count citations within their own database. A 2013 Scopus journal article averaged 9.2 forward citations from other Scopus articles while a 2013 CNKI journal article averaged 2.3 forward citations from other CNKI articles. This suggests a citation-based exchange rate of about 0.25 (= 2.3/9.2) for CNKI articles compared to Scopus articles.
But this excludes citations across the databases, which neither database counts. To estimate cross-database citations, we drew random samples of 2000 non-Chinese language Scopus papers and of 500 Chinese language papers in CNKI from 2013 to 2017 and counted their references to 2013 publications. References are, by definition, backward citations from later papers to earlier papers, and thus the forward citations of earlier papers. CNKI papers are far more likely to cite Scopus articles than the reverse. About half of journal references in CNKI articles to 2013 publications were to Scopus articles, while just 0.29% of journal references in Scopus articles to 2013 publications were to CNKI Chinese language papers. Extrapolating, we estimate that 2013 Scopus articles received 3,276,350 citations from CNKI articles through 2017 whereas 2013 CNKI articles received l32,196 citations from non-Chinese language Scopus articles. Adding these citations to the number of citations in Scopus and CNKI reduces the exchange rate of a CNKI journal article from 0.25 to 0.20 of a Scopus paper. Valuing a CNKI publication at 1/5th of a Scopus publication we estimated the total number of Scopus equivalent papers in the two data sets and found that China contributed 36% of these articles.
Rising quality of Chinese scientific research
We explored further the quality of Chinese scientific articles in the Scopus database by analyzing the citations those papers received from other Scopus papers. In 2000, papers with all-Chinese addresses received just 29% of the world average of citations while international collaborations and papers with Chinese names working at non-Chinese addresses received more citations than the world average. The best research by Chinese scientists was being conducted outside of China. By 2013, citations to papers with all-China addresses increased to 70% of the global average while collaborative work and work done outside China converged toward the average. China’s share of global citations rose from 7.4% in 2000 to 19.5% in 2013, due primarily to the increased share of citations to all-China addressed papers.
As a final look at the quality of China’s contribution to science, we examined the percentage of Chinese names and Chinese addresses in papers published in Nature and Science. In 2016, about 20% of names on papers in these journals were Chinese while 8% to 9% of addresses were Chinese – far above 7-8% of names and 0.5% of addresses in 2000.
In total, we estimate that China obtained 37% of Scopus equivalent citations. With 18% of the world’s population and world GDP, China’s 36% of 2016 papers and 37% of 2013 citations show that it is essentially contributing twice its weight to the advance of science. While our calculations ignore scientific articles outside Scopus in languages other than Chinese, we estimate that taking account of these would lower our estimated China contribution by less than 3 to 4 percentage points.
Conclusion
That China, one of the lowest income countries in the world at the turn of the 21st century, became a super-power in scientific knowledge in less than two decades is a remarkable development in the history of science. The way China deploys its newly developed scientific resources will drive the direction of science and technology into the foreseeable future and the direction of our increasingly knowledge-based economy. In the 19th century, Horace Greeley famously advised Americans to “Go West, young man, and grow up with the country.” In the 21st century, science is going East and will grow up with China.
(Qingnan Xie, Nanjing University of Science &Technology & Labor and Worklife Program, Harvard Law School; Richard B. Freeman, Harvard & the NBER.)
Tollefson, Jeff (2018). “China Declared World’s Largest Producer of Scientific Articles,” Nature, News, 553 (25 January): 390. doi.org/10.1038/d41586-018-00927-4
Xie, Qingnan, and Richard B. Freeman (2018). “Bigger than You Thought: China’s Contribution to Scientific Publications,” NBER Working Paper 24829 (July).
Xie, Yu, Chunni Zhang, and Qing Lai (2014). “China’s Rise as a Major Contributor to Science and Technology,” PNAS 111(26) (July): 9437-9442. doi.org/10.1073/pnas.1407709111.

Latest
Most Popular
- VoxChina Covid-19 Forum (Second Edition): China’s Post-Lockdown Economic Recovery VoxChina, Apr 18, 2020
- China’s Great Housing Boom Kaiji Chen, Yi Wen, Oct 11, 2017
- China’s Joint Venture Policy and the International Transfer of Technology Kun Jiang, Wolfgang Keller, Larry D. Qiu, William Ridley, Feb 06, 2019
- The Dark Side of the Chinese Fiscal Stimulus: Evidence from Local Government Debt Yi Huang, Marco Pagano, Ugo Panizza, Jun 28, 2017
- Wealth Redistribution in the Chinese Stock Market: the Role of Bubbles and Crashes Li An, Jiangze Bian, Dong Lou, Donghui Shi, Jul 01, 2020
- Evaluating Risk across Chinese Housing Markets Yongheng Deng, Joseph Gyourko, Jing Wu, Aug 02, 2017
- What Is Special about China’s Housing Boom? Edward L. Glaeser, Wei Huang, Yueran Ma, Andrei Shleifer, Jun 20, 2017
- Privatization and Productivity in China Yuyu Chen, Mitsuru Igami, Masayuki Sawada, Mo Xiao, Jan 31, 2018
- Daily Price Limits and the Magnet Effect Ting Chen, Zhenyu Gao, Jibao He, Wenxi Jiang, Wei Xiong, Oct 25, 2017
- How did China Move Up the Global Value Chains? Hiau Looi Kee, Heiwai Tang, Aug 30, 2017


