
A Bridge on Economic Issues between China and the World



 Facebook
  Twitter
  Instagram
 WeChat
  Email
Email The Unseen Costs of Blue Skies: How Narrow Air Pollution Targets Fuel Ozone Rise and Biodiversity Loss
China’s war on pollution has been recognized as a remarkable success. The Particulate Matter 2.5 (PM₂.₅) concentrations have fallen sharply since 2013, saving millions of lives. But there is a less visible side to this story. In our recent study, we show that the same policy unintentionally caused another pollutant, ground‑level ozone (O₃), to rise significantly. The increased O₃ not only harms human health, but also damages ecosystems, including a measurable decline in bird abundance. Our back-of-the-envelope calculation shows that the additional O₃-attributed deaths and ecological damage offset approximately 23.8% of the health benefits gained from reducing PM₂.₅. In short, focusing on a single pollutant can create new, hidden problems that undermine some of the gains we had achieved.
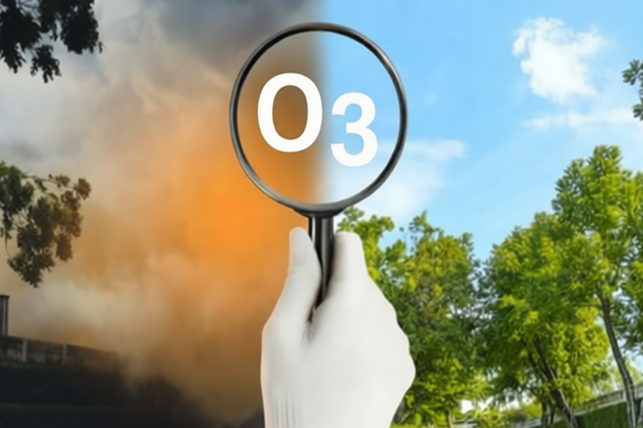
Air pollution control is one of modern China’s most visible environmental successes. Facing a public health crisis caused by fine particulate matter, the government launched the “War on Pollution” in 2013. It imposed binding PM₂.₅ reduction targets on local officials, backed by a nationwide monitoring network, and tied these targets to career outcomes. As a result, PM₂.₅ concentrations have dropped sharply, averting millions of premature deaths (Greenstone et al. 2021; Barwick et al. 2024). But have these gains come at a hidden cost? In our recent working paper (Graff Zivin et al. 2026), we show that the same policies that cleared the skies also unintentionally fueled a surge in ground-level ozone (O₃) and triggered significant biodiversity loss. Such unintended costs have largely been overlooked in public debates and previous literature.
Figure 1. The “Great Divergence” of PM₂.₅ and O₃ Concentrations in China (2010–2019)
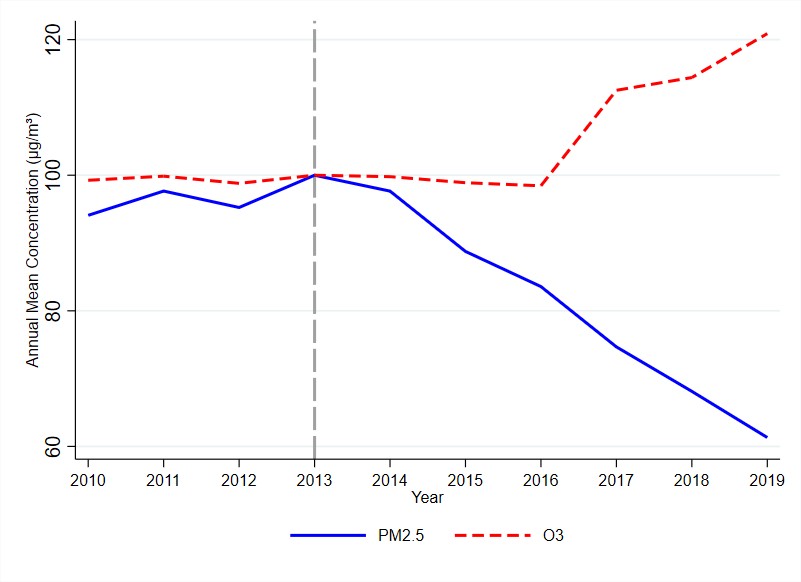
Notes: This figure displays the average pollutant indices (normalized to 100 in 2013) for the period 2010–2019. The vertical dashed line indicates the 2013 launch of China’s “War on Pollution.”
A great divergence: PM₂.₅ down, O₃ up
Leveraging the staggered rollout of China’s monitoring network as a quasinatural experiment, we compare pollutant concentrations in urban areas (where monitors were placed and enforcement was intense) to those in rural areas (largely unmonitored). Using high-resolution, satellite-derived pollution data from 2010 to 2019, we find that after monitor installation, PM₂.₅ concentrations in treated urban areas fell by approximately 0.573 μg/m³ relative to rural controls. However, over the same period, O₃ levels rose by a strikingly similar magnitude (about 0.560 μg/m³). This divergence is not explained by preexisting trends and is robust to a battery of sensitivity checks, including controlling for spillover effects, placebo tests, and heterogeneity-robust estimators.
Figure 2. The Dynamic Effects of the Policy on the Pollutant Concentrations
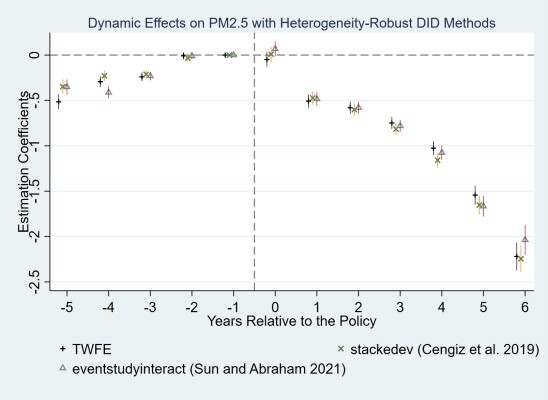
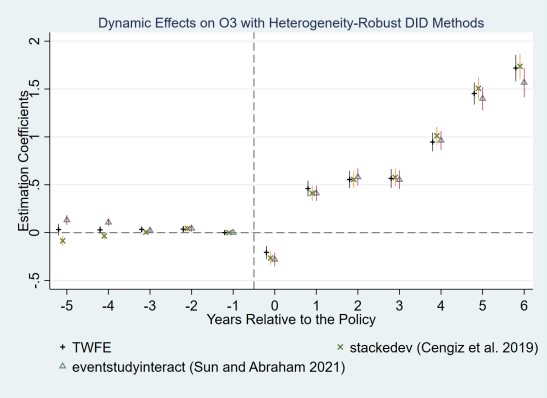
Notes: This figure demonstrates the dynamic effects on pollutant concentrations using different models. The dots represent point estimates and the vertical lines represent 90% confidence intervals. All models include meteorological control variables, grid fixed effects, and city-year fixed effects. Standard errors are clustered at the grid-cell level. The year prior to the policy (k=-1) is the omitted base category.
Why did O₃ rise? The political economy of asymmetric enforcement
The rise in O₃ is not a mere atmospheric accident. It mainly stems from two pathways. The first is the behavioral pathway. Facing binding PM₂.₅ targets and limited governance capabilities, local officials rationally concentrated enforcement on the most easily controllable precursors, such as SO₂ from large point sources like power plants. In contrast, they neglected VOCs, which originate from diffuse sources like small industries and vehicle exhaust, and which are costlier to monitor. Using grid-level emission inventories, we show that the policy reduced SO₂ emissions by approximately 20.7% but had no significant effect on NOx and actually increased VOC emissions by approximately 13.5%. This asymmetric abatement increased the VOCs-NOx ratio, which shifts atmospheric chemistry toward O₃ formation, particularly in VOC-limited urban regimes (Wang et al. 2019, Li et al. 2019).
The second is the physicochemical pathway. PM₂.₅ itself suppresses O₃ formation by scavenging radical precursors (Li et al. 2019, Le et al. 2020). Thus, the policy-induced decline in PM₂.₅ directly removes this natural brake, further boosting O₃ levels. Our decomposition suggests that about 73.8% of the observed O₃ increase can be attributed to this physicochemical effect, with the remaining 26.2% driven by uneven precursor abatement. This result is consistent with existing scientific literature, such as Li et al. (2019).
From pollutant substitution to biodiversity loss
O₃ is not merely a respiratory irritant; it is a potent phytotoxicant that damages vegetation and reduces insect populations, with cascading effects on wildlife (Agathokleous et al. 2020; Liang et al. 2020). To quantify these ecological costs, we turn to citizen-science bird observation data from the China Bird Report Center, constructing measures of bird abundance and bird species richness. Leveraging the difference-in-differences framework, we find that the policy led to a significant decline in both bird abundance and species richness in treated urban areas relative to rural areas. In addition, using a two-stage framework, we find that the policy-induced O₃ increase is the mechanism linking the policy to bird diversity loss.
Figure 3. The Dynamic Effects of the Policy on Bird Diversity
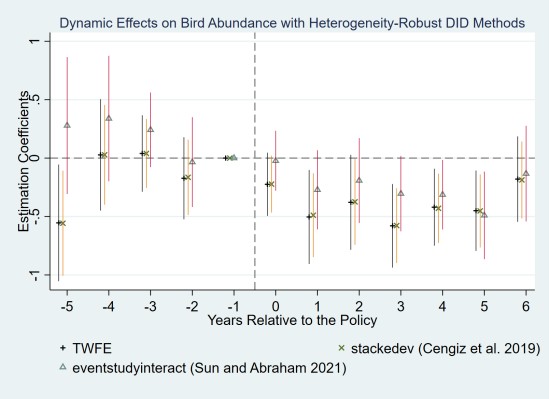
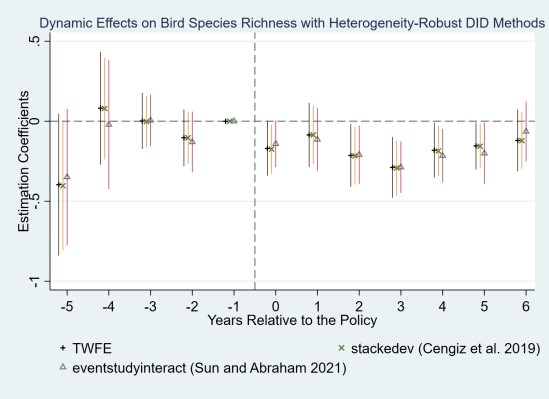
Notes: This figure reports the dynamic effects on bird diversity with different models. The plotted estimates are the estimated coefficients with 90% confidence intervals. All models control for the meteorological variables, city-area fixed effects, and city-year fixed effects. Standard errors are clustered at the city-area level.
The price of cleaner air: Offsetting benefits by approximately 23.8%
How large are these unintended costs? We conduct a back-of-the-envelope welfare calculation. Using the value of a statistical life (VSL), we estimate that the policy significantly reduced PM₂.₅-attributed deaths in urban areas relative to rural areas, yielding health benefits of about $66.2 billion (2015 USD). However, the policy also caused additional O₃-attributed deaths in urban areas, costing roughly $11.7 billion (2015 USD). Moreover, the policy-induced biodiversity loss, valued using household willingness-to-pay for bird conservation, adds another $4.1 billion (2015 USD) in ecological damages. Together, these O₃-related health and ecological costs offset approximately 23.8% of the gross health benefits from PM₂.₅ reduction. And because we capture only a subset of O₃’s ecological impacts (e.g., excluding crop yield losses and broader ecosystem degradation), this is likely a conservative estimate.
Lessons for pollutant governance
Our findings carry two important implications for environmental policy design, well beyond China. First, the results highlight the dangers of single-pollutant accountability frameworks. When performance metrics are narrow, agents will re-optimize across unmeasured dimensions, potentially substituting one harm for another. Effective governance requires multi-pollutant targets that internalize these cross-effects. Encouragingly, China’s latest Action Plan (2023) has begun emphasizing co-control of PM₂.₅ and O₃, as well as joint abatement of NOx and VOCs.
Second, our results underscore the need to incorporate ecological endpoints into policy evaluation. Meeting air quality standards does not guarantee ecosystem health. As governments worldwide pursue ambitious clean air goals, they should also consider biodiversity indicators, such as bird abundance or other proxy species, to ensure that the “blue skies” we achieve are not devoid of life. The unseen costs of narrowly targeted regulation are real, measurable, and too important to ignore.
References
Agathokleous, Evgenios, Zhaozhong Feng, Elina Oksanen, et al. 2020. “Ozone Affects Plant, Insect, and Soil Microbial Communities: A Threat to Terrestrial Ecosystems and Biodiversity.” Science Advances 6 (33):eabc1176. https://doi.org/10.1126/sciadv.abc1176.
Barwick, Panle Jia, Shanjun Li, Liguo Lin, and Eric Yongchen Zou. 2024. “From Fog to Smog: The Value of Pollution Information.” American Economic Review 114 (5): 1338–81. https://doi.org/10.1257/aer.20200956.
Graff Zivin, Joshua S., Siyuan Li, Huanhuan Wang, and Zhiqiang Zhang. 2026. “The Unseen Costs of Blue Skies: Pollutant Substitution and Biodiversity Loss.” National Bureau of Economic Research Working Paper No. 35087. https://doi.org/10.3386/w35087.
Greenstone, Michael, Guojun He, Shanjun Li, and Eric Yongchen Zou. 2021. “China’s War on Pollution: Evidence from the First 5 Years.” Review of Environmental Economics and Policy 15 (2): 281–99. https://doi.org/10.1086/715550.
Le, Tianhao, Yuan Wang, Lang Liu, et al. 2020. “Unexpected Air Pollution with Marked Emission Reductions during the COVID-19 Outbreak in China.” Science 369 (6504): 702–706. https://doi.org/10.1126/science.abb7431.
Li, Ke, Daniel J. Jacob, Hong Liao, Lu Shen, Qiang Zhang, and Kelvin H. Bates. 2019. “Anthropogenic Drivers of 2013–2017 Trends in Summer Surface Ozone in China.” Proceedings of the National Academy of Sciences 116(2): 422–27. https://doi.org/10.1073/pnas.1812168116.
Liang, Yuanning, Ivan Rudik, Eric Yongchen Zou, Alison Johnston, Amanda D. Rodewald, and Catherine L. Kling. 2020. “Conservation Cobenefits from Air Pollution Regulation: Evidence from Birds.” Proceedings of the National Academy of Sciences 117 (49): 30900–30906. https://doi.org/10.1073/pnas.2013568117.Wang, Nan, Xiaopu Lyu, Xuejiao Deng, et al. 2019.
“Aggravating O₃ Pollution Due to NOx Emission Control in Eastern China.” Science of the Total Environment 677:732–44. https://doi.org/10.1016/j.scitotenv.2019.04.388.

Latest
Most Popular
- VoxChina Covid-19 Forum (Second Edition): China’s Post-Lockdown Economic Recovery VoxChina, Apr 18, 2020
- China’s Great Housing Boom Kaiji Chen, Yi Wen, Oct 11, 2017
- China’s Joint Venture Policy and the International Transfer of Technology Kun Jiang, Wolfgang Keller, Larry D. Qiu, William Ridley, Feb 06, 2019
- The Dark Side of the Chinese Fiscal Stimulus: Evidence from Local Government Debt Yi Huang, Marco Pagano, Ugo Panizza, Jun 28, 2017
- Wealth Redistribution in the Chinese Stock Market: the Role of Bubbles and Crashes Li An, Jiangze Bian, Dong Lou, Donghui Shi, Jul 01, 2020
- Evaluating Risk across Chinese Housing Markets Yongheng Deng, Joseph Gyourko, Jing Wu, Aug 02, 2017
- Daily Price Limits and the Magnet Effect Ting Chen, Zhenyu Gao, Jibao He, Wenxi Jiang, Wei Xiong, Oct 25, 2017
- What Is Special about China’s Housing Boom? Edward L. Glaeser, Wei Huang, Yueran Ma, Andrei Shleifer, Jun 20, 2017
- Privatization and Productivity in China Yuyu Chen, Mitsuru Igami, Masayuki Sawada, Mo Xiao, Jan 31, 2018
- How did China Move Up the Global Value Chains? Hiau Looi Kee, Heiwai Tang, Aug 30, 2017