A Bridge on Economic Issues between China and the World


 Facebook
  Twitter
  Instagram
 WeChat
  Email
Email Environmental Externalities, Product Attributes, and Market Power: Implications for Government Subsidies
Many countries use subsidies that target product attributes to promote the diffusion of energy-efficient products to combat climate change. These subsidies are often referred to as attribute-based subsidies (ABSs). We develop a theoretical framework for the optimal design of such policies to account for endogenous product attributes, environmental externalities, and market power. We use China’s electric vehicle market as a case study to evaluate the welfare impacts of various subsidy designs. Compared to uniform subsidies, commonly used ABS designs lead to higher product quality and are more effective in mitigating market power, albeit with a modest environmental cost. Between 42% to 62% of welfare gains under ABSs relative to uniform subsidies are attributed to more desirable product attributes, with the remainder explained by reductions in market power distortions. Allowing subsidy redistribution through product-level subsidies, as suggested by our theoretical model, further enhances welfare gains by an additional 34% to 62%.

Many countries use subsidies to promote the diffusion of energy-efficient products to combat climate change. These subsidies are often designed to target product attributes related to their environmental benefits and are referred to as attribute-based subsidies (ABSs). At the same time, manufacturers of these products often wield significant market power and change product attributes in response to government policies. Prominent examples include consumer subsidies for energy efficient products (Davis, Fuchs, and Gertler 2014) and climate vouchers.
Existing literature on the optimal policy design of these subsidies, and more generally, attribute-based regulations (Ito and Sallee 2018, Kellogg 2018), has abstracted away from firms’ market power, a common feature in markets subject to attribute-based regulations. Our recent paper (Barwick, Kwon, and Li 2024) bridges this gap and analyzes both theoretically and empirically the optimal design of ABSs in oligopolistic industries. To the best of our knowledge, our framework represents the first attempt in the literature to incorporate three key features, namely, market power, externalities, and endogenous attributes of products by multiproduct firms, in the context of attribute-based policy design.
ABSs take the form of a two-part subsidy (i.e., a two-part tariff) in our setting: a base subsidy that is the same across products and a variable subsidy that is tied to product attributes. This is common in practice and standard in the theoretical literature. Our theoretical analyses begin by considering an ideal benchmark where a government can perfectly target the environmental externality and faces no budget constraints, and there is a single-product monopoly. It is straightforward to show that the government can achieve the first-best social outcome with a Pigouvian policy design, where the base subsidy fully addresses quantity distortion, and the variable subsidy corrects environmental externality. In practice, all three assumptions are likely violated. Environmental externality may be hard to quantify and target, governments face limited budgets, and many industries are characterized by multiproduct oligopolies.
When a government has a limited budget, it is suboptimal to tie the variable subsidy to environmental externality as prescribed by the traditional Pigouvian subsidy. We show that with multiproduct oligopolies, optimality conditions require higher subsidies to products that exhibit high welfare gains for the marginal unit and products whose demand is more responsive to subsidies in order to equalize the marginal social surplus generated by each subsidy dollar across all products.
The theoretical characterization of optimal policy design crucially hinges on the underlying consumer preferences and production technology. We illustrate our theoretical insight using an empirical analysis of the market for electric vehicles (EVs) as a case study. Together with a cleaner electrical grid, EVs offer considerable promise for reducing carbon emissions and local air pollution. Many governments have provided generous consumer purchase subsidies, with global public spending on consumer EV subsidies approaching $30 billion in 2021 (International Energy Agency 2022). The design of these subsidies varies across countries. Some countries tie the subsidy amount to vehicle attributes, such as driving range in China and Japan, battery capacity in the US and India, and vehicle size and weight in South Korea. Other countries offer uniform subsidies, as seen in Germany, the Netherlands, and Sweden. The EV sector is very concentrated. The top six firms accounted for 70% and 75% of vehicle sales in China and US, respectively, during our sample period. Our analysis focuses on China, by far the world’s largest automobile and EV market, accounting for 40% of global new passenger vehicle sales and 60% of global EV sales in 2022.
China became the largest EV market in 2015, and its global share increased to 60% by 2022. The rapid growth of the EV market in China was at least partly driven by the generous consumer subsidies from both central and local governments as well as nonfinancial incentives (such as green license plates and exemptions from vehicle purchase and driving restrictions) as documented in Li et al. (2022). The Chinese government considers the EV sector a strategic priority to increase the global competitiveness of its domestic automobile industry and to reduce energy consumption and emissions from the transportation sector.
The subsidies are based on the driving range and set differently for battery electric vehicles (BEVs) and plug-in hybrid electric vehicles (PHEVs). For BEVs, the subsidies are notched with several cutoffs. The minimum range requirement increased from 80km in 2013 to 100km in 2016 and further increased to 150km in 2018, while the amount of subsidies was reduced over time. For PHEVs, the subsidy was uniform across models with a minimum range requirement of 50km that remained constant, though the subsidy amount decreased over time.
How did automakers manage to enhance their driving ranges in response to policy changes? The driving range is primarily affected by battery capacity and vehicle weight, both of which can be adjusted relatively quickly. Figure 1 illustrates the year-to-year changes in vehicle weight (excluding battery weight) on the x-axis and battery capacity on the y-axis. Blue circles represent models with increased driving ranges, while red diamonds are models with decreased driving ranges. The size of the symbol corresponds to the magnitude of the change. Almost all vehicles in our sample expanded their driving range, with some increases exceeding 100km. These enhancements in driving range were accompanied by significant increases in battery capacity and, quite often, a reduction in net vehicle weight.
Figure 1. Changes in Vehicle Attributes

Note: The top figure plots the year-to-year changes in net vehicle weight (exclusive of battery weight) on x-axis, and battery capacity on y-axis by vehicle model. The blue circles depict models with increasing driving ranges; the size of the circle represents the magnitude of the change. The red diamonds depict models with decreasing driving ranges; these changes are small, as shown by the sizes of the diamonds. The bottom figure depicts the histograms of the changes in driving range.
We estimate an equilibrium model of the Chinese automobile market and incorporate endogenous attributes. Our model allows firms to change product designs in response to subsidy schemes, a crucial factor in welfare impacts and policy comparisons. The demand side captures rich consumer preference heterogeneity and controls for extensive fixed effects to capture local variations that affect demand for EVs and internal combustion engines (ICEs). On the supply side, firms choose prices and design vehicle attributes (battery capacity and vehicle weight net of battery) for EVs to maximize profits. Crucially, both the marginal and fixed cost of production depend on vehicle attributes.
With model primitives estimated, we next conduct counterfactual simulations to compare the uniform subsidy (which does not target attributes) with commonly used ABSs, such as those based on driving range, battery capacity, and vehicle weight. Our counterfactual simulations provide several key findings. First, ABSs generate significant gains in consumer surplus relative to the uniform subsidy, ranging from ¥226 million in 2017 under the notched range-based design to ¥643 and ¥680 million under capacity- and weight-based subsidies, respectively. ABSs induce more desirable vehicle attributes and more effectively address quantity distortions than the uniform subsidy. The increase in consumer surplus is relatively modest for range-based policies because it leads to vehicle downsizing, which is undesirable to consumers. Firms producing BEVs also benefit from the ABS design that redistributes subsidies from the low-end spectrum of the vehicle attribute space to the high-end spectrum, though such profit gains are an order of magnitude smaller than increases in consumer surplus and are more than offset by profit losses of ICEs. The environmental performance of the EV fleet deteriorates moderately under ABSs as sales shift to larger and less environmentally friendly EVs. In total, ABS designs result in significant welfare gains compared to the uniform subsidy, ranging from ¥97.2 million under the current notched range subsidy to ¥448 million under the capacity subsidy in 2017.
Second, China’s notched range-based subsidy design is better than flat subsidies, but it leads to a large welfare loss relative to a linear subsidy, consistent with findings in the public finance literature. Figure 2 plots the distribution of the BEV driving range under the notched design in red and the linear design in blue. The contrast between the two distributions is stark: while there is strong bunching with the notched subsidy design, bunching disappears with the linear subsidy design. As documented by Sallee and Slemrod (2012) in the context of fuel economy standards, there are two inefficiencies associated with a notched policy. First, there might be excessive bunching whereby firms alter weight and battery capacity to reach the driving range cutoffs. Second, firms have no incentive to improve attributes incrementally between the cutoffs. Shifting from the notched range-based policy to a linear range-based (or even better, capacity-based) policy would significantly increase welfare.
Figure 2. Driving Range: Notched vs. Linear Design
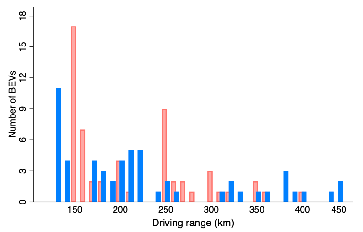
Notes: The figure depicts the observed distribution of BEVs’ driving ranges under the notched subsidy policy in 2017 (in red) and the counterfactual distribution under the linear subsidy design (in blue). Aggregate subsidy expenditures are the same under both designs. With a linear subsidy, bunching along the cutoffs disappears and the social welfare increases by ¥ 135 million.
Third, a decomposition exercise indicates that changes in vehicle attributes account for 42% to 62% of total welfare gains under ABSs relative to the uniform subsidy. The reduction in market power distortions explains the remaining 38% to 58% of the welfare gains. Allowing subsidy redistribution at the product level, as suggested by the theoretical discussions, further enhances welfare gains by another 34% to 62%. Fixing vehicle attributes, as is commonly done in the literature, significantly understates aggregate welfare gains and leads to the erroneous conclusion that firm profit increases for the auto sector. These findings underscore the role of endogenous product attributes in understanding the impacts of ABSs.
Reference
Barwick, Panle Jia, Hyuk-Soo Kwon, and Shanjun Li. 2024. “Attribute-Based Subsidies and Market Power: An Application to Electric Vehicles.” National Bureau of Economic Research Working Paper No. 32264. https://doi.org/10.3386/w32264.
Borenstein, Severin, and Lucas Davis. 2024. “The Distributional Effects of US Tax Credits for Heat Pumps, Solar Panels, and Electric Vehicles.” Haas School of Business, University of California, Berkeley, Working Paper. https://haas.berkeley.edu/wp-content/uploads/WP348.pdf.
Davis, Lucas W., Alan Fuchs, and Paul Gertler. 2014. “Cash for Coolers: Evaluating a Large-Scale Appliance Replacement Program in Mexico.” American Economic Journal: Economic Policy 6 (4): 207–38. https://doi.org/10.1257/pol.6.4.207.
International Energy Agency. 2022. “Global EV Outlook 2022.” International Energy Agency Technical Report. https://www.iea.org/reports/global-ev-outlook-2022.
Ito, Koichiro, and James M. Sallee. 2018. “The Economics of Attribute-Based Regulation: Theory and Evidence from Fuel Economy Standards.” Review of Economics and Statistics 100 (2): 319–36. https://doi.org/10.1162/REST_a_00704.
Kellogg, Ryan. 2018. “Gasoline Price Uncertainty and the Design of Fuel Economy Standards.” Journal of Public Economics 160: 14–32. https://doi.org/10.1016/j.jpubeco.2018.02.013.
Li, Shanjun, Xianglei Zhu, Yiding Ma, Fan Zhang, and Hui Zhou. 2022. “The Role of Government in the Market for Electric Vehicles: Evidence from China.” Journal of Policy Analysis and Management 41 (2): 450–85. https://doi.org/10.1002/pam.22362.
Sallee, James M., and Slemrod, Joel. 2012. “Car Notches: Strategic Automaker Responses to Fuel Economy Policy.” Journal of Public Economics 96 (11–12): 981–99. https://doi.org/10.1016/j.jpubeco.2012.06.005.
Stavins, Robert N. 2006. “Vintage-Differentiated Environmental Regulation.” Stanford Environmental Law Journal 25 (29): 29–63. https://scholar.harvard.edu/files/stavins/files/vintage_differentiated_regulation_by_stavins.pdf.

Latest
Most Popular
- VoxChina Covid-19 Forum (Second Edition): China’s Post-Lockdown Economic Recovery VoxChina, Apr 18, 2020
- China’s Great Housing Boom Kaiji Chen, Yi Wen, Oct 11, 2017
- China’s Joint Venture Policy and the International Transfer of Technology Kun Jiang, Wolfgang Keller, Larry D. Qiu, William Ridley, Feb 06, 2019
- The Dark Side of the Chinese Fiscal Stimulus: Evidence from Local Government Debt Yi Huang, Marco Pagano, Ugo Panizza, Jun 28, 2017
- Wealth Redistribution in the Chinese Stock Market: the Role of Bubbles and Crashes Li An, Jiangze Bian, Dong Lou, Donghui Shi, Jul 01, 2020
- Evaluating Risk across Chinese Housing Markets Yongheng Deng, Joseph Gyourko, Jing Wu, Aug 02, 2017
- What Is Special about China’s Housing Boom? Edward L. Glaeser, Wei Huang, Yueran Ma, Andrei Shleifer, Jun 20, 2017
- Privatization and Productivity in China Yuyu Chen, Mitsuru Igami, Masayuki Sawada, Mo Xiao, Jan 31, 2018
- Daily Price Limits and the Magnet Effect Ting Chen, Zhenyu Gao, Jibao He, Wenxi Jiang, Wei Xiong, Oct 25, 2017
- How did China Move Up the Global Value Chains? Hiau Looi Kee, Heiwai Tang, Aug 30, 2017


