A Bridge on Economic Issues between China and the World


 Facebook
  Twitter
  Instagram
 WeChat
  Email
Email What Gets Measured Gets Managed: Investment and the Cost of Capital
To improve capital allocative efficiency, starting in 2010, Chinese regulators switched from using return on equity to economic value added (EVA). However, this EVA policy takes a one-size-fits-all approach by stipulating a fixed cost of capital for virtually all state-owned enterprises (SOEs), neglecting the potential heterogeneity of firm-specific costs of capital. We show that SOEs responded to evaluation reform by altering their investment decisions, particularly when the actual borrowing rate deviated further from the stipulated cost of capital. Besides providing an estimate of the cost of capital's impact on investment, our study offers causal evidence that incentive schemes affect real investment and sheds new light on economic reform challenges in China.
Background

Correct incentive schemes are critical to making things right. Many reforms China conducted in the past several decades have been along this line. The capital market is one important area that still needs significant improvement. Not surprisingly, it has been the target of the reform.
The root cause of capital allocative inefficiency in China is a well-known policy distortion wherein Chinese SOEs have access to cheaper credit and hence overinvest relative to their private peers (e.g., Song, Storesletten, and Zilibotti 2011; Brandt, Tombe, and Zhu 2013). If we can move the capital from less efficient SOEs to more efficient ones or from SOEs to more productive non-SOEs, we may mitigate capital misallocation and improve aggregate capital productivity.
With exactly the above-stated purpose, the Chinese government, through State-Owned Assets Supervision and Administration Commissions (SASACs), revised the way that SOEs were evaluated. Previously the SASACs had used formula-based schemes to evaluate SOEs. One key input in these schemes was return on equity (ROE). Some SASACs later replaced ROE with economic value added (EVA)—this came to be widely known as “the EVA reform.” Because EVA includes a change for the cost of all capital employed by a firm, it has been applauded as a measure of economic profit and is fundamentally sounder than ROE, which captures only accounting profit. SASACs adopted the EVA policy in different years. The first SASAC adopted the EVA policy in 2010, some others adopted it shortly thereafter, and still others did not adopt it until 2015 (the end of the sample period).
However, as has been typical in reforms conducted in any transition economy worldwide, the devil is in the details. Instead of using firm-specific costs of capital as a full-blown risk-based theory would suggest, the Chinese central SASAC—which lacks knowledge of local information a la Hayek (1945) and Huang et al. (2017)—set the after-tax cost of capital at 5.5% for virtually all SOEs under its control. In other words, the implementation of EVA reform ignores the potential heterogeneity of firm-specific cost of capital. While the motivation of the EVA policy was to kill the bad cost-of-capital dispersion due to policy distortion, it may also kill the good dispersion due to the heterogeneity in risks.
Empirical predictions
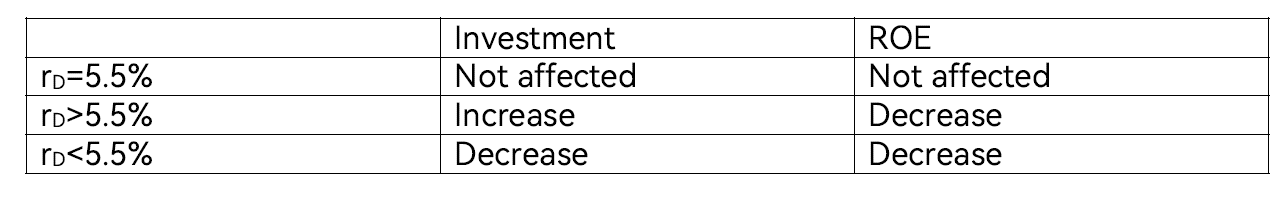
The EVA reform has clear predictions for how firms will react. Specifically, it predicts that SOEs with a cost of capital higher than 5.5% will increase their investment because the new hurdle rate is lower. Similarly, SOEs with a cost of capital lower than 5.5% will decrease their investment. From the perspective of shareholders, neither change in investment is beneficial: the increase in investment represents overinvestment and the decrease in investment represents underinvestment. Table 1 summarizes the predictions.
Table 1. Theoretical predictions
Incentives matter
Investment
We use the listed firms as our main sample. The data are from the China Stock Market & Accounting Research (CSMAR) Database. We manually collected the details of the EVA policy for each province, relying primarily on performance evaluation reports or announcements on the SASAC websites and occasionally on our direct contact with SASAC officials. We start the sample from 2004 because the central and most provincial SASACs began evaluating SOEs that year. We end the sample in 2015 because the central SASAC revised the EVA policy but did not disclose the details of the new policy.
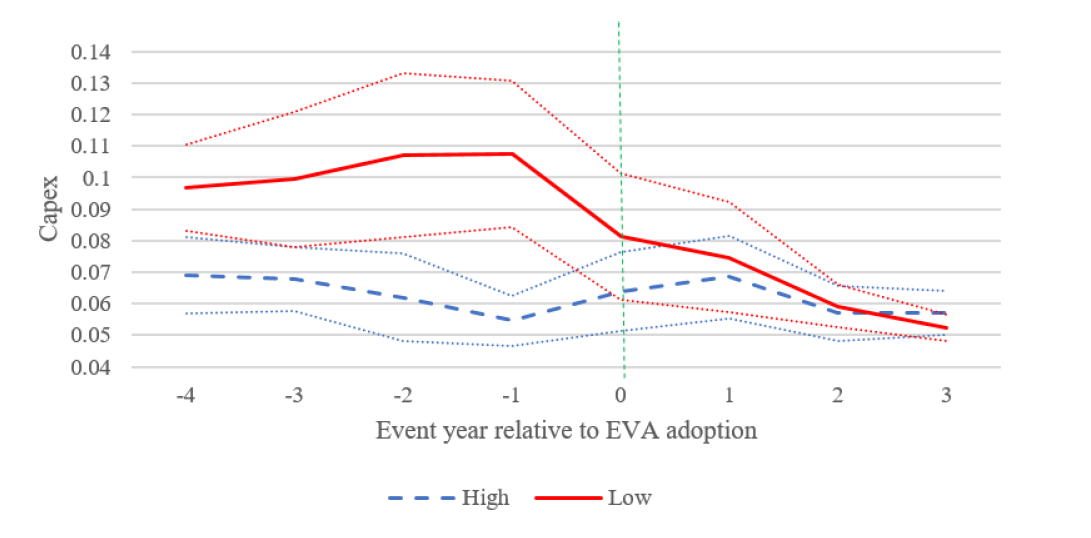
Figure 1 presents the evolution of CapEx (defined as capital expenditure divided by lagged assets) for different interest rate groups in the raw data. Panel A reports the results of the treatment SASACs (i.e., SASACs that adopted the EVA policy), and Panel B reports the results of the control SASACs. Specifically, we sort firms into high and low InterestRate groups by the sample median in each EVA adoption year based on the interest rate in the last year before the EVA adoption. We report the mean of firm investment (with 95% confidence intervals) from four years before (t-4) to four years after (t+3) the EVA adoption. Year 0 is the first year that the EVA policy became effective.
Panel A. Treated
Panel B. Control
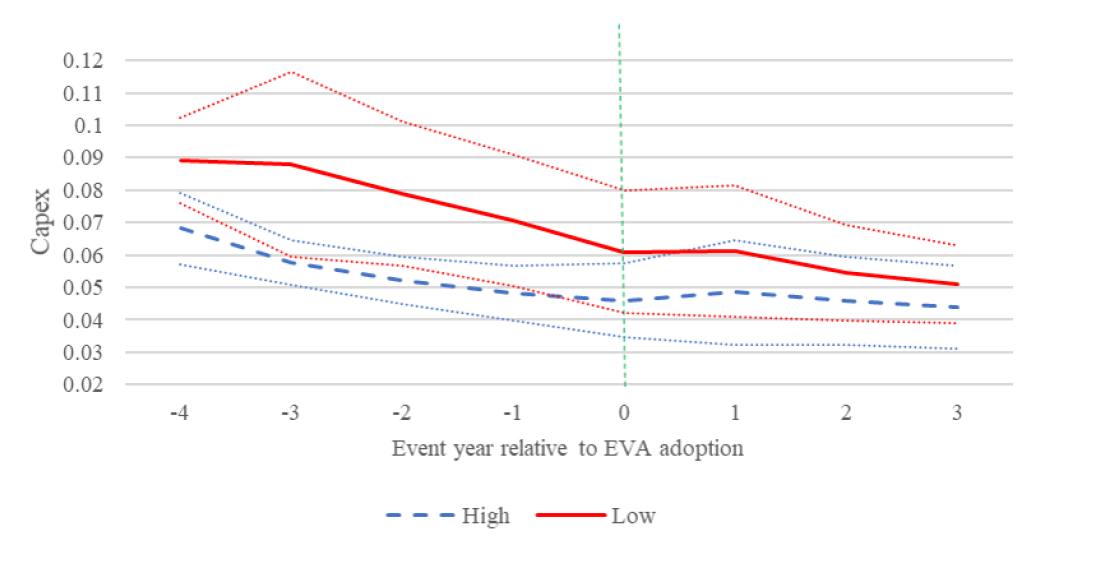
Figure 1 shows that higher interest rate firms increased their investment relative to the low interest rate firms. The investment levels of the two groups of firms are parallel before the policy adoption for both the treated firms and the control firms. Among the treated firms, the investment gap between the high and low interest rate groups shrinks from a 3–5% pre-EVA-adoption level to almost zero. Most of the shrinkage occurs in the EVA adoption year (year 0). Among the control firms, the investment gap between the high and low interest rate groups shrinks from a pre-EVA-adoption level of 2% to 1%. The shrinkage is much smaller, and the shrinkage spreads out over the years rather than being concentrated in year 0.
One concern of the analysis is that EVA timing can be endogenous. Several tests suggest that this is unlikely to affect our results. First, the timing does not seem to correlate with a list of business cycle and political economy factors. Second, we address this concern directly by exploiting the unique institutional feature that some SOEs are not located in the province of their SASAC. For example, Yaxing Coach, a bus manufacturer based in Jiangsu province, is controled by Shandong SASAC. These firms and the central SASAC firms enable us to add province*year fixed effects to control for time-varying province-level factors. We find very similar results in this specification. Third, we also use the non-SOEs as a placebo test as they were not subject to the EVA policy. The null result of this sample further confirms the causal interpretation of our main results
ROE
Figure 2 presents the results of ROE. Similar to the investment analysis, everything is relative to the control firms. To quantify the nonmonotone impact of the EVA policy on firm performance, we group all firms into six groups by interest rate. Specifically, we classify firms with an interest rate below 2.5%, between 2.5% and 4.5%, between 4.5% and 6.5%, between 6.5% and 8.5%, between 8.5% and 10.5%, and higher than 10.5%, as groups indexed by g=1, 2, ..., and 6, respectively. The range of interest rates is wider for groups 1 and 6 because the density of firms in the tails is lower.
We use group 4 as the base group. All other estimates are relative to the estimate of group 4. Figure 2 displays the relation between InterestRate groups and change in firm performance graphically, confirming that EVA policy-induced ROE reduction grows with the gap between a firm's interest rate and the policy-stipulated one, in both directions.
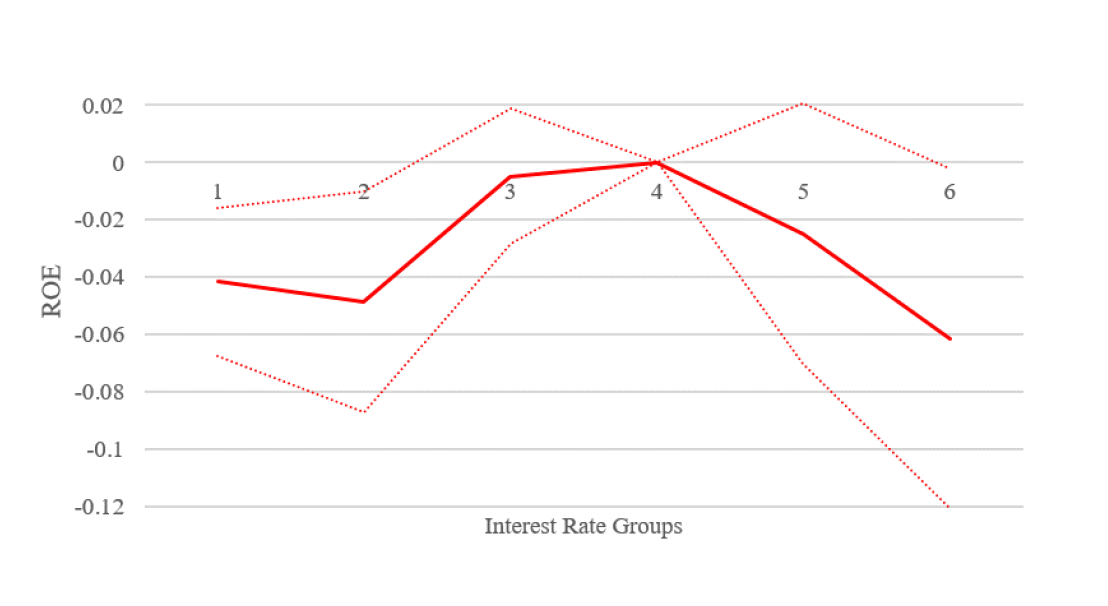
Figure 2. The EVA and ROE
Results on capital allocative efficiency
We also study whether the EVA policy improves capital allocative efficiency from a social perspective. Although the EVA policy hurts individual firms’ performance (from the shareholders’ perspective), it may improve aggregate capital productivity by mitigating capital misallocation, either within SOEs (say, moving the capital from less efficient SOEs to more efficient ones) or from SOEs to more productive non-SOEs.
We base our welfare discussion on a framework where risk plays an important role in determining a firm’s cost of capital and hence the economy-wide capital allocative efficiency. Risk is not highlighted in the literature pioneered by Hsieh and Klenow (2009) but is central to the finance literature (say, the classic capital asset pricing model by Sharpe [1964] and Lintner [1965]). The EVA's welfare implication crucially depends on whether the true cost of capital, which reflects the fair market-based risk compensation, is equal across firms. Intuitively, the observed dispersion in interest rates could either be driven by policy distortions—so a "bad" dispersion—or could also be driven by heterogeneous risk premia—so a "good" dispersion. A "one-size-fits-all" EVA policy could kill both bad and good dispersions and, therefore, potentially do more harm than good to social welfare.
In our empirical investigation, we first study the capital allocative efficiency within the SOE sector. After constructing a measure for the true cost of capital based on the pre-EVA data, we document that, in response to the EVA policy, industries with a higher true cost of capital increased their investment more than industries with a lower true cost of capital. Under the assumption that SOEs in the same industry share the same cost of capital, this hints at a negative welfare impact of the one-size-fits-all EVA policy. A further variance decomposition exercise shows that, in our data, only about half of the cross-SOE variations in their actual costs of capital (i.e., including policy distortions) are within-industry variations. Since within-industry variations represent "bad" dispersion under the premise of equal cost of capital within any industry, this result constitutes a warning that the EVA policy could kill a significant amount of good dispersion present in the actual costs of capital. Overall, we offer preliminary but mixed evidence as to whether the EVA reform improves the overall allocative efficiency within SOEs, and we await future research on this important question.
As for the second question of capital reallocation from SOEs to non-SOEs, we find no evidence that non-SOEs increased their investment more than SOEs after the EVA policy, suggesting no improvement on this front. This is consistent with the criticism that the cost of capital stipulated by SASACs was not high enough.
Key takeaways
Our paper shows that the EVA reform influenced real activities by changing the hurdle rates for capital budgeting, and we stress that it should not be taken for granted that economic incentives matter for the business operation of SOEs.
From this perspective, our findings that “SOE reforms do matter” serve as a positive sign for China's future, as many researchers consider Chinese SOEs—especially central SOEs—to be run like political bureaucracies, with a significant number of them operating beyond the control of the SASACs. What’s more, our analysis shows that if the EVA policy can be implemented based on firm-specific “local knowledge” a la Hayek (1945), such a reform could potentially bring significant welfare improvement. Perhaps because it is aware of the potential pitfalls of the fixed stipulation in the cost of capital, in 2016 the Chinese central SASAC switched to using the firm-specific cost of capital for its EVA evaluations (though it did not disclose how the cost of capital is calculated).
References
Brandt, Loren, Trevor Tombe, and Xiaodong Zhu. 2013. “Factor Market Distortions Across Time, Space, and Sectors in China.” Review of Economic Dynamics 16 (1): 39–58. https://doi.org/10.1016/j.red.2012.10.002.
Hayek, Friedrich A. 1945. “The Use of Knowledge in Society.” American Economic Review 35 (4): 519–30. https://www.jstor.org/stable/1809376.
Hsieh, Chang-Tai, and Peter J. Klenow. 2009. “Misallocation and Manufacturing TFP in China and India.” Quarterly Journal of Economics 124 (4): 1403–48. https://doi.org/10.1162/qjec.2009.124.4.1403.
Huang, Zhangkai, Lixing Li, Guangrong Ma, and Lixin Colin Xu. 2017. “Hayek, Local Information, and Commanding Heights: Decentralizing State-Owned Enterprises in China.” American Economic Review 107 (8): 2455–78. https://doi.org/10.1257/aer.20150592.
Lintner, John. 1965. “Security Prices, Risk, and Maximal Gains from Diversification.” Journal of Finance 20 (4): 587–615. https://doi.org/10.2307/2977249.
Sharpe, William F. 1964. “Capital Asset Prices: A Theory of Market Equilibrium under Conditions of Risk.” Journal of Finance 19 (3): 425–42. https://doi.org/10.1111/j.1540-6261.1964.tb02865.x.
Song, Zheng, Kjetil Storesletten, and Fabrizio Zilibotti. 2011. “Growing Like China.” American Economic Review 101 (1): 196–233. https://doi.org/10.1257/aer.101.1.196.

Latest
Most Popular
- VoxChina Covid-19 Forum (Second Edition): China’s Post-Lockdown Economic Recovery VoxChina, Apr 18, 2020
- China’s Great Housing Boom Kaiji Chen, Yi Wen, Oct 11, 2017
- China’s Joint Venture Policy and the International Transfer of Technology Kun Jiang, Wolfgang Keller, Larry D. Qiu, William Ridley, Feb 06, 2019
- The Dark Side of the Chinese Fiscal Stimulus: Evidence from Local Government Debt Yi Huang, Marco Pagano, Ugo Panizza, Jun 28, 2017
- Wealth Redistribution in the Chinese Stock Market: the Role of Bubbles and Crashes Li An, Jiangze Bian, Dong Lou, Donghui Shi, Jul 01, 2020
- Evaluating Risk across Chinese Housing Markets Yongheng Deng, Joseph Gyourko, Jing Wu, Aug 02, 2017
- What Is Special about China’s Housing Boom? Edward L. Glaeser, Wei Huang, Yueran Ma, Andrei Shleifer, Jun 20, 2017
- Privatization and Productivity in China Yuyu Chen, Mitsuru Igami, Masayuki Sawada, Mo Xiao, Jan 31, 2018
- Daily Price Limits and the Magnet Effect Ting Chen, Zhenyu Gao, Jibao He, Wenxi Jiang, Wei Xiong, Oct 25, 2017
- How did China Move Up the Global Value Chains? Hiau Looi Kee, Heiwai Tang, Aug 30, 2017


