A Bridge on Economic Issues between China and the World


 Facebook
  Twitter
  Instagram
 WeChat
  Email
Email Centralization or Decentralization? The Evolution of State-Ownership in China
To better understand the Chinese economy, we propose a new set of measures of state-owned enterprises (SOEs) based on dynamic equity ownership networks (EquiNet) of 40 million registered firms from 1990 to 2017. The SOE measures precisely reflect equity ownership stakes and a firm’s hierarchical distance to central, provincial, and city governments. State ownership shows both trends of decentralization (a decline in central government ownership) and indirect control (an increase in local government ownership via greater hierarchical distance) over time.

After growing at exceptionally high rates for more than four decades, the Chinese economy has become the largest in the world in terms of purchasing power parity (PPP). Some scholars have attributed China’s economic success to a model of “state capitalism” (e.g., Naughton 2018). As of 2019, China has 129 business groups in Fortune’s Global 500, reaching parity with the US, and 80% of the Chinese groups in the list are state-owned enterprises (SOEs), the so-called Chinese “national champions” (Lin and Milhaupt 2013). Abundant empirical evidence has shown, however, that SOEs are less productive and have lower investment efficiency than non-SOEs (e.g., Allen, Qian, and Qian 2005; Zhu 2012).
Understanding SOEs is crucial to the study of the Chinese economy. In 1994, the State-Owned Assets Supervision and Administration Commission (SASAC) of the State Council announced Doctrine 81, in which two types of state control are stipulated: 1) absolute control if the state owns 50% or more equity of a firm; and 2) relative control if the state is the largest shareholder and owns an equity stake between 30% and 50%. In our recent working paper, Allen et al. (2022b), we re-examine the state sector in China, using the dynamic equity ownership networks (EquiNet) of over 40 million Chinese firms for the period of 1990–2017. The dynamic EquiNet was constructed in our earlier work, Allen et al. (2022a), based on firm-to-firm equity investment records that date back to 1990 of all the registered firms in China from the registration and ownership database originated from China’s State Administration for Industry and Commerce (SAIC). By 2017, the EquiNet included 35 million out-of-network firms and 5.6 million in-network firms. The total registered capital of the in-network firms accounted for approximately 80% of the total capital of all the registered firms in China.
A common “classification” system of ownership types of Chinese firms in most prior literature is based on the self-reported ownership status from firm registration in the Annual Industry Surveys (AIS) conducted by the National Bureau of Statistics. In Allen et al. (2022b), we document widespread discrepancies between SOEs based on self-reported ownership types (at registration) and “state control status,” the two main identifiers used in AIS and employed by many existing studies, and our set of new measures based on EquiNet. A few earlier studies, including Dollar and Wei (2007) and Hsieh and Song (2015), also point out problems with the existing classification system. In particular, the existing classification of SOEs based on the self-reported ownership does not take into account “indirect” ownership—that is, a government agency, or an SOE, can be a partial owner of a firm through indirect ownership stakes along the ownership tree, which we describe next.
SOE Trees and SOE Index for All Firms Based on EquiNet
We build SOE trees year by year. For each year, we start by identifying “root” firms that are directly controlled/owned by all central, provincial, and city-level governments, respectively. We grow the trees by tracing firms that are owned by the roots using different ownership thresholds (100%, 50%, 30%, 10%, >0%) and iterate this procedure layer-by-layer until there are no further connected firms. This algorithm allows us to identify SOEs with various ownership thresholds and measures the “hierarchical distance” between a firm and a government branch (of central, provincial and city governments). We find a significantly larger number of SOEs than the existing measures, as well as large inconsistencies between our measure and the existing measures in SAIC. For example, if comparing our SOE measure using the 30% threshold with the SOE identifier in SAIC data by registration type in 2017, at the central, provincial and city levels, our measure identifies 628,544 SOEs, compared to only 391,490 SOEs identified by the registration type in SAIC data. Only 167,544 firms (26.7% of SOEs by our measure) are identified as SOEs by both measures (Table 1). next.
Aggregate Evidence of State Ownership in China
Using our measure, we find a number of stylized facts on state ownership in China. Firstly, although the aggregated capital of all (partial) SOEs increased from 61% in 1999 to 85% in 2017, among all the 5.6 million in-network firms, the aggregate capital of wholly SOEs (100% as threshold) decreased from 40% in 1999 to 25% in 2017 (Figure 1). Secondly, state ownership shows both trends of decentralization and indirect control over time. On one hand, there is a different trend of ownership among central, provincial, and city governments: while the state capital from the central government declines, capital from provincial and city governments increases over time (Figure 2). On the other hand, direct control of the government declines, indicating that indirect control, as defined by local governments’ ownership via greater hierarchical distance, increases over time (Figure 3).
Mixed Ownership and Firms’ Hierarchical Distance to Governments
We reexamine the effects of state ownership as well as the hierarchical distance to the governments on firm performance based on our SOE measure with different thresholds. We find that, consistent with the prior literature, mixed ownership of central/provincial state ownership and private ownership promotes firm growth, profitability, and productivity. While the government’s objective of maintaining social stability sometimes deviates from “value maximization,” state ownership can still bring a variety of compensating benefits, such as preferential debt financing and more government subsidies (e.g., Lin and Tan 1999, Jiang and Kim 2020). Therefore, we hypothesize that firms with mixed ownership, especially indirect government ownership stakes, can combine the advantage of government support and the efficiency of private firms.
We also find that a greater hierarchical distance between the firm and the central/local governments is associated with better firm performance, but lower growth of total assets, and the results are robust after controlling for firms’ geographical distance to the governments. Specifically, firms closer to central and provincial governments in the ownership hierarchy tend to have higher growth rates, while firms more remotely owned by governments tend to have higher profitability and efficiency. Firms with shorter distance to central and provincial governments are perhaps more likely to receive assistance to support their growth, but they may lose independence in their operations and thus efficiency/profitability due to the government’s nonprofit objectives. These results support the view that different levels of government can play the roles of “helping hand” (Allen, Qian, and Qian 2005) and/or “grabbing hand” (Shleifer and Vishny 1998).
In conclusion, we developed an SOE index for all 40 million firms in China from 1990 to 2017 based on the dynamic EquiNet. This quantitative index is solely based on equity investments and thus clears up the mysteries of other self-report measures. This may provide a rich vein of future studies on the role of government in the Chinese economy.
Table 1: Discrepancy of SOEs by Our Measure and SAIC Registration Type: 2017
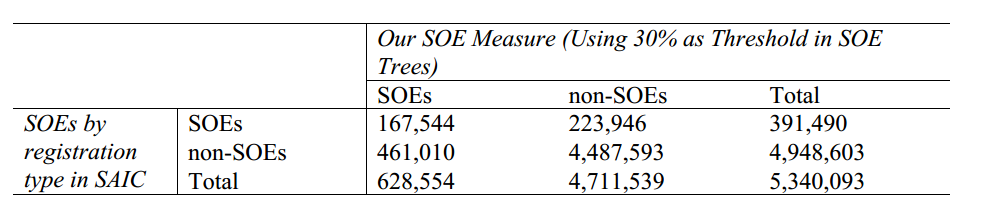
Notes: In 2017, there are in total 5.6 million firms in EquiNet, either investing in other firms or being invested in by other firms through equity. Out of the 5.6 million in-network firms, the SOE measure by registration type in SAIC covers 5.3 million firms with the rest having missing values. The discrepancies between our set of new measures and the existing classification system could come from multiple sources. First, we use updated (annually) equity ownership information to identify SOEs in our measure. As documented by Dollar and Wei (2007), some former SOEs do not change their registered ownership type after ownership restructuring. Second, the SOE measure by registration type in SAIC is based on firms’ self-reported information at registration, similarly to AIS data for industrial firms. Some firms might have an incentive to hide their actual ownership information. For example, Hsieh and Song (2015) find that many firms directly or indirectly controlled by SASAC are legally registered as private firms, while some privately owned firms may use SASAC to mask their ownership stake for various reasons.
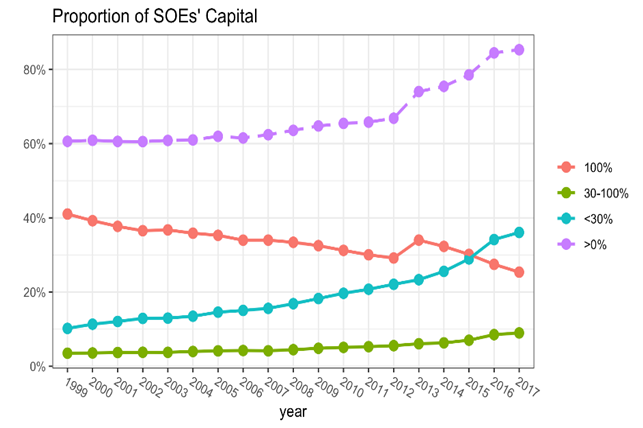
Figure 1: Proportion of SOEs’ Capital: 1999–2017
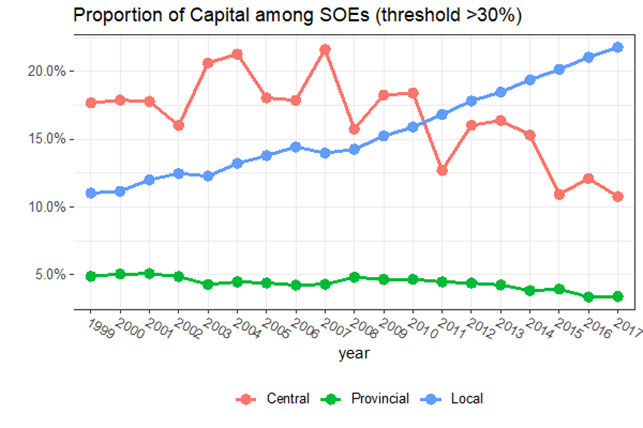
Figure 2: Proportion of SOEs’ Capital: Central vs. Local Governments
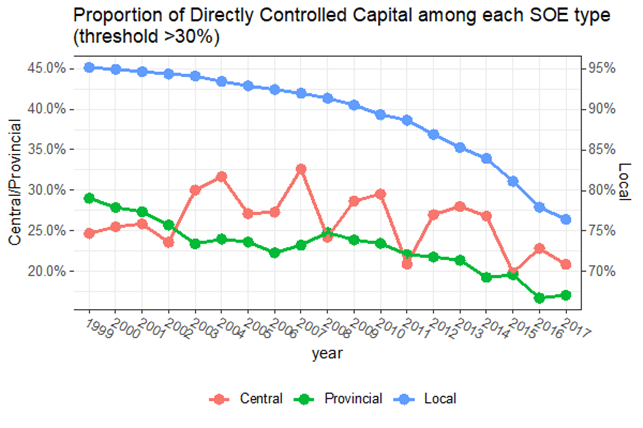
Figure 3: Proportion of SOEs’ Capital Directly Owned by the State
References
Allen, Franklin, Junhui Cai, Xian Gu, Jun “QJ” Qian, Linda Zhao, and Wu Zhu. 2022a. “Ownership Network and Firm Growth: What Can Forty Million Companies Tell Us About the Chinese Economy?” SSRN Working Paper 3465126. https://dx.doi.org/10.2139/ssrn.3465126.
Allen, Franklin, Junhui Cai, Xian Gu, Jun “QJ” Qian, Linda Zhao, and Wu Zhu. 2022b. “Centralization or Decentralization? The Evolution of State-Ownership in China.” SSRN Working Paper 4283197. https://dx.doi.org/10.2139/ssrn.4283197.
Allen, Franklin, Jun Qian, and Meijun Qian. 2005. “Law, Finance, and Economic Growth in China.” Journal of Financial Economics 77 (1): 57–116. https://doi.org/10.1016/j.jfineco.2004.06.010.
Dollar, David, and Shang-Jin Wei. 2007. “Das (Wasted) Kapital: Firm Ownership and Investment Efficiency in China.” NBER Working Paper No. 13103. https://doi.org/10.3386/w13103.
Hsieh, Chang-Tai, and Zheng (Michael) Song. 2015. “Grasp the Large, Let Go of the Small: The Transformation of the State Sector in China.” NBER Working Paper No. 21006. https://doi.org/10.3386/w21006.
Jiang, Fuxiu, and Kenneth A. Kim. 2020. “Corporate Governance in China: A Survey.” Review of Finance 24 (4): 733–72. https://doi.org/10.1093/rof/rfaa012.
Lin, Justin Yifu, and Gnofu Tan. 1999. “Policy Burdens, Accountability, and the Soft Budget Constraints.” American Economic Review 89 (2): 422–27. https://doi.org/10.1257/aer.89.2.426.
Lin, Li-Wen, and Curtis J. Milhaupt. 2013. “We Are (National) Champions: Understanding the Mechanisms of State Capitalism in China.” Stanford Law Review 65 (4): 697–759. https://www.jstor.org/stable/23530170.
Naughton, Barry. 2018. “State Enterprise Reform Today.” In China’s 40 Years of Reform and Development, 1978–2018, edited by Ross Garnaut, Ligang Song, and Cai Fang. Canberra: Australian National University Press. https://doi.org/10.22459/CYRD.07.2018.
Shleifer, Andrei, and Robert W. Vishny. 1998. The Grabbing Hand: Government Pathologies and Their Cures. Cambridge: Harvard University Press.
Zhu, Xiaodong. 2012. “Understanding China’s Growth: Past, Present, and Future.” Journal of Economic Perspective 26 (4): 103–24. https://doi.org/10.1257/jep.26.4.103.

Latest
Most Popular
- VoxChina Covid-19 Forum (Second Edition): China’s Post-Lockdown Economic Recovery VoxChina, Apr 18, 2020
- China’s Great Housing Boom Kaiji Chen, Yi Wen, Oct 11, 2017
- China’s Joint Venture Policy and the International Transfer of Technology Kun Jiang, Wolfgang Keller, Larry D. Qiu, William Ridley, Feb 06, 2019
- The Dark Side of the Chinese Fiscal Stimulus: Evidence from Local Government Debt Yi Huang, Marco Pagano, Ugo Panizza, Jun 28, 2017
- Wealth Redistribution in the Chinese Stock Market: the Role of Bubbles and Crashes Li An, Jiangze Bian, Dong Lou, Donghui Shi, Jul 01, 2020
- Evaluating Risk across Chinese Housing Markets Yongheng Deng, Joseph Gyourko, Jing Wu, Aug 02, 2017
- What Is Special about China’s Housing Boom? Edward L. Glaeser, Wei Huang, Yueran Ma, Andrei Shleifer, Jun 20, 2017
- Privatization and Productivity in China Yuyu Chen, Mitsuru Igami, Masayuki Sawada, Mo Xiao, Jan 31, 2018
- Daily Price Limits and the Magnet Effect Ting Chen, Zhenyu Gao, Jibao He, Wenxi Jiang, Wei Xiong, Oct 25, 2017
- How did China Move Up the Global Value Chains? Hiau Looi Kee, Heiwai Tang, Aug 30, 2017


