A Bridge on Economic Issues between China and the World


 Facebook
  Twitter
  Instagram
 WeChat
  Email
Email Superstition Everywhere
In Chinese culture, digit 8 (4) is taken as lucky (unlucky). We find that the numerological superstition has a profound impact across China’s stock, bond and foreign exchange markets, affecting asset prices in both the primary and secondary markets. The superstition effect, i.e., the probability of asset price ending with a lucky (unlucky) digit far exceeds (falls short of) what would be expected by chance, is everywhere. The effect is likely driven by investors’ reliance on superstition to alleviate the concern of uncertainty in asset prices. While the superstition effect does not imply any systemic mispricing for assets traded mainly by sophisticated investors, it is significantly associated with overpricing for assets involving more unsophisticated investors.

Superstition has existed since the dawn of human civilization. Divination and sacrificial offering were widely practiced before important events, including wars, across ancient civilizations. Even today, superstition, as a cultural heritage, remains prevalent in many countries. For instance, in Western culture, since the number 13 is considered unlucky, Formula 1 auto racing bans the number 13 in its entry list for cars (Saward 2009). In Chinese culture, the number 8 is widely considered lucky because it represents “good fortune” and “longevity,” while the number 4 is unlucky because in Chinese it sounds similar to the word “death.” For this reason, the opening ceremony of the Beijing 2008 Summer Olympic Games officially started at 8:08 p.m. on August 8, 2008, while many apartment buildings avoid floors 4, 14, etc. (Kramer and Block 2008). Given the importance of superstition as a global cultural phenomenon, its existence and real impact in financial markets deserve examination.
Taking advantage of China’s unique numerological superstition culture, we have examined stock and bond prices in both primary and secondary markets. According to the Chinese institution, the hundredths digit of an asset’s price would be reported as the last digit, if it is nonzero. Otherwise, the tenths digit of the price would be the last digit. In this study, we focus on the probability of 8 and 4 as the last digit conditional on the hundredths place being the last digit. If an asset’s price ends with the hundredth digit being 8 (4), it would be referred to as a lucky (unlucky) price. We find that for stocks and bonds in both primary and secondary markets, the probability of observing a lucky (unlucky) price far exceeds (falls short of) what would be expected by chance. We refer to this phenomenon as the superstition effect.
To understand the prevalence of the superstition effect, we propose an uncertainty hypothesis. Unlike risk, which can be modeled and resolved rationally through statistical methodologies, uncertainty is related to the intrinsic ambiguity of an asset, which cannot be resolved completely using any rational models. When facing the uncertainty of asset value, numerological superstition is commonly used to alleviate investors’ concern. The implication of the uncertainty hypothesis is that the superstition effect will be stronger for assets with more uncertain fundamentals and for assets traded more by unsophisticated investors, who are more likely to resort to superstition due to lack of information and expertise.
Is the superstition effect linked to systemic mispricing? Here we propose two hypotheses. One is the anchoring hypothesis. Since sophisticated investors’ preference for a certain number is irrelevant to their pricing prowess, when asset price is determined by sophisticated investors, superstition would not systemically bias it, but only add some random noise. Another hypothesis is the overoptimism hypothesis. For unsophisticated investors, overoptimism about the underlying asset is correlated with numerological superstition; as such, when asset prices are more driven by unsophisticated investors, the superstition effect provides an indication of overpricing.
Superstition in the stock market
Stock primary market: Our stock market IPO data is collected from the China Stock Market & Accounting Research (CSMAR) database. The data sample is from January 1, 1995 to March 31, 2021. During the sample period, we collected 4,032 firm IPO cases. We find strong superstition effect for IPO prices in the main board and the Growth Enterprise Market (GEM) board when IPO pricing is more flexibly determined by the market from January 1, 1995 to July 1, 2014. During this period, the probabilities of the lucky and unlucky price conditional on the hundredths place as the last digit reached 33.20% and 4.63%. They both deviate from 1/9 (see footnote 1) substantially. The superstition effect disappeared immediately after July 1, 2014, when strict IPO price control was implemented and the market no longer determined IPO price. The time series of annual probabilities of lucky and unlucky prices conditional on the hundredths place as the last digit are plotted in Figure 1, which demonstrates the robustness and persistence of the superstition effect.
The subsample analysis shows that, for IPOs during the flexible price control period, high P/E ratio firms have a stronger superstition effect than low PE firms. Moreover, the Fama-MacBeth analysis indicates that firms with lucky IPO prices generate lower post-IPO three-year abnormal returns than other IPO firms by about -15%. These findings are consistent with the overoptimism hypothesis.
Seasoned equity offering: The superstition effect exists in seasoned equity offering (SEO) pricing as well. Given the fact that private equity placement (PEP) is the dominant form of SEO in China (see footnote 2), we focus on PEP and find that the conditional probabilities of lucky and unlucky price reach 13.71% and 8.26%, which are significantly different from 1/9. The time series of annual probabilities of lucky and unlucky prices are plotted in Figure 1. The superstition effect in SEO is weaker than that in IPO, which is consistent with the uncertainty hypothesis in that the SEO firms are less uncertain and the participants of SEO are more sophisticated. In contrast to IPO, we find neither the correlation between P/E ratio and superstition effect nor the cross-sectional predictability of lucky price. These findings are consistent with the anchoring hypothesis for sophisticated investors.
Stock secondary market: We focus on the stock open and close prices as they are the two most important secondary market prices. We collected the daily open and close prices for stocks traded in both Shanghai and Shenzhen stock exchange from CSMAR during the period from July 1, 2006 to September 30, 2021. Our sample cover 4,443 stocks and 3,713 transaction days in total.
In China, while the stock open price has always been determined by batched call auction in our sample period, the mechanism of the close price formation has changed over time (see footnote 3). When open and close prices are both determined by auction, if investors are more likely to bid/ask for lucky prices and avoid unlucky ones, the conditional probabilities of lucky (unlucky) open and close prices should be higher (lower) than otherwise purely determined by chance, 1/9. We indeed find robust superstition effect for both open and close prices, when they are determined by batched call auction. More specifically, the conditional probability of lucky (unlucky) open price is 13.59% (8.56%) and the conditional probability of lucky (unlucky) close price is 12.42% (9.93%). They are all significantly larger (smaller) than 1/9. The superstition effect exists among both large market cap and small market cap stocks with similar magnitude. As a placebo test, we find no similar superstition effect for close prices, which are determined by the value weighted average trading prices during the last minute. The time series of annual probabilities of lucky and unlucky prices are plotted in Figure 1.
To examine the asset pricing implications of superstition in the secondary market, we construct long-short portfolios. More specifically, we calculate the frequency difference between the lucky and unlucky close price during the past month for each stock (see footnote 4). We then sort stocks into quintiles based on the frequency difference and go long stocks in the quintile with the largest frequency difference and sell short stocks in the quintile with the smallest frequency difference. The long-short portfolio is held for a month before a new portfolio is constructed. The strategy can generate an abnormal return of 0.5% per month for small stocks, when the close prices are determined by batched auction. The outperformance reverses in the following 3 months. The short-term predictability and long-term reversal together lend support on the overoptimism hypothesis for small stocks, which are mainly traded by individual investors. In comparison, for large stocks, which are traded more by institutional investors, the long-short strategy does not generate any significant result, although there is strong superstition effect for close price. The insignificant result for large stocks is consistent with the anchoring hypothesis.
Superstition in the bond market
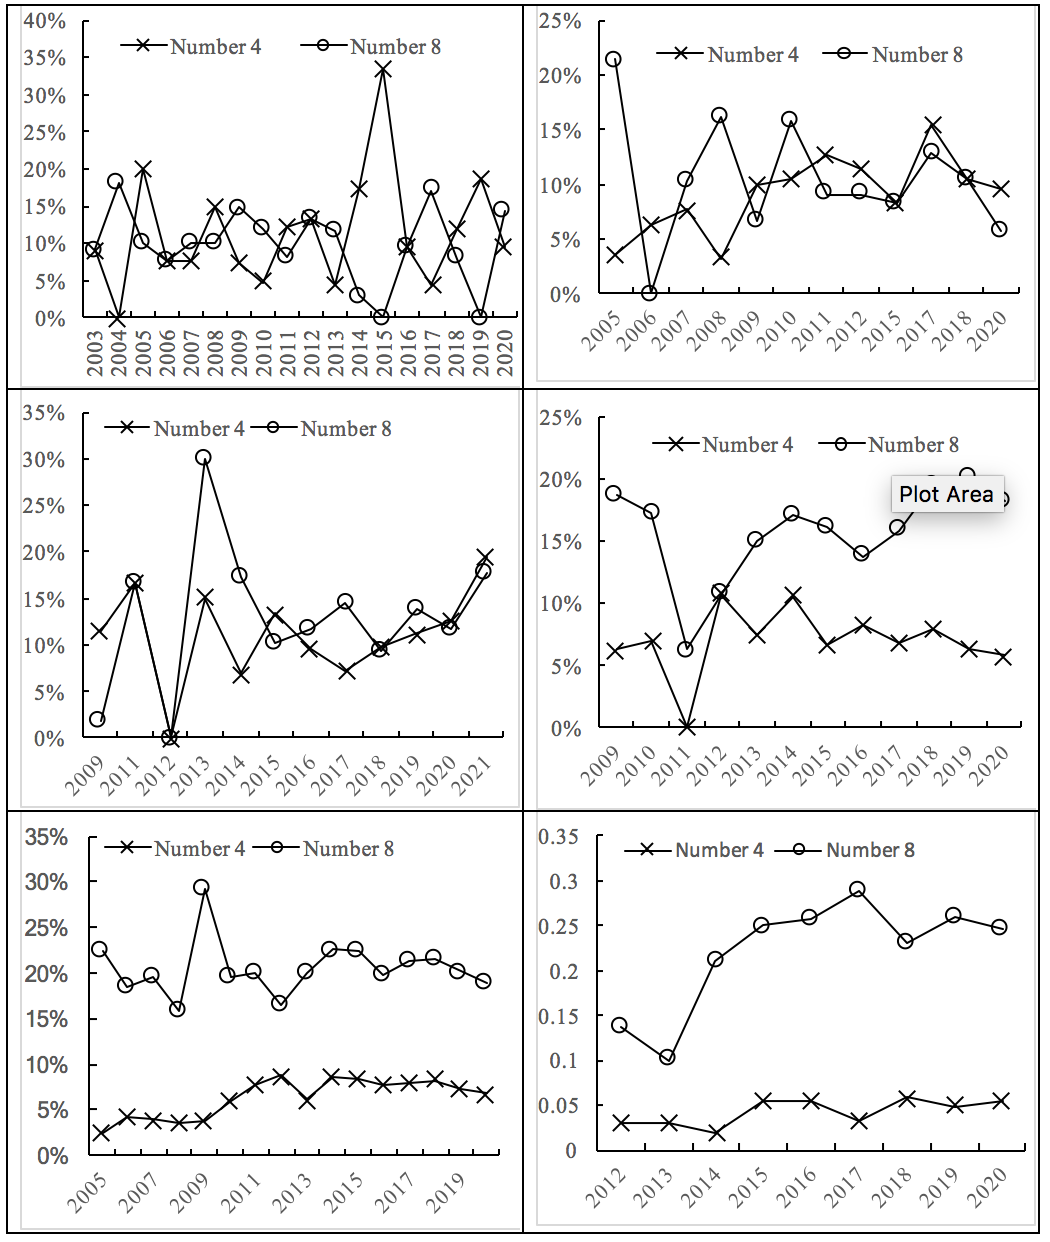
Bond primary market: Our bond issuance data are collected from CSMAR during the period from January 1, 1991 to March 31, 2021. There are 566 Treasury Bonds with a aggregated face value of 31.21 trillion yuan; 642 National Policy Bank Bonds, with a total face value of 19.54 trillion yuan; 8,081 Local Government Bonds with a total face value of 34.19 trillion yuan; 4,772 Financial Bonds with a total face value of 16.50 trillion yuan; 48,450 public Non-Financial Corporate (NFC) Bonds with a total face value of 59.60 trillion yuan; and 12,551 private NFC Bonds with a total face value of 10.67 trillion yuan.
We find no significant price superstition effect for risk-free bonds, including Treasury Bonds, National Policy Bank Bonds, and Local Government Bonds, but significant superstition effect for bonds with credit risk, including Financial Bonds as well as public and private NFC Bonds. The conditional probabilities of bonds with lucky (unlucky) coupon rates for Treasury, National Policy Bank, Local Government, Financial, and public and private NFC Bonds are 9.94% (10.80%), 10.89% (10.89%), 11.86% (10.44%), 17.56% (7.14%), 20.34% (7.41%) and 24.18% (5.23%), respectively. The time series of annual conditional probabilities of lucky and unlucky prices are plotted in Figure 2. These findings are consistent with the uncertainty hypothesis in the sense that the risk-free bonds bear the minimal uncertainty due to the lack of credit default risk (see footnote 5). Similarly, we discover that bonds with a lower credit rating have a stronger superstition effect in every bond category.
Finally, while the superstition effect exists in both the interbank and exchange markets, the effect is stronger for bonds issued in the exchange market. For instance, the conditional probabilities of the lucky (unlucky) coupon rate in the interbank and exchange market are 22.25% (6.83%) and 16.52% (9.42%) for Financial Bonds. This result lends further support to the uncertainty hypothesis as the interbank market is composed of more sophisticated investors than the exchange market.
We further explore the association between the superstition effect and bond pricing in the primary market. We find that for the public NFC Bonds issued in exchange, bonds with lucky coupon rates have a yield spread of 5.36 bps lower than those without. In contrast, there is no similar significant pricing impact of the lucky coupon rate on bonds issued in the interbank market. Similarly, for Financial Bonds, while the lucky coupon rate is associated with lower issuance yield spread for bonds issued in the exchange market, it is not for bonds issued in the interbank market. These findings suggest that while the overoptimism hypothesis holds in the exchange market, where investors are less sophisticated, the anchoring hypothesis better fits the interbank market. It is also worth noting that there is no significant result for private NFC Bonds in either the exchange or interbank market as only the most sophisticated investors participate in private NFC issuance.
Bond secondary market: We also examine the superstition effect in the bond secondary market. Our daily close price data include 311 Treasury Bonds from March 25, 1994 to September 30, 2021, 417 National Policy Bank Bonds from June 12, 2000 to September 30, 2021, 747 Local Government Bonds from April 3, 2009 to September 30, 2021, 1,434 Financial Bonds from October 20, 2004 to September 30, 2021, and 18,082 public NFC Bonds from June 30, 1995 to September 30, 2021.
Our results show significant superstition effect in bond close price for all types of bonds in the exchange market. More specifically, the conditional probabilities of bonds with lucky (unlucky) close price for Treasury, National Policy Bank, Local Government, Financial, and public and private NFC Bonds are 13.08% (8.48%), 12.28% (9.58%), 10.76% (8.03%), 12.23% (7.55%), 13.95% (7.46%) and 11.58% (10.75%), respectively. There is no similar effect in the interbank market due to the trading mechanism, which does not allow the existence of the superstition effect in close price.
Foreign exchange market: We finally examine the superstition effect in the foreign exchange market, which are mainly participated by banks. Our data include the daily close exchange rate of US dollar, Euro and Japanese Yen against Chinese Yuan from January 1, 1994 to September 30, 2021. These three currencies are the most actively traded ones in China’s foreign exchange market. Our results show significant superstition effect for the exchange rates of all three currencies. More specifically, the probabilities of the US dollar, Euro and Japanese Yen with lucky (unlucky) close exchange rate are 12.52% (9.65%), 12.21% (10.90%), and 12.35% (9.41%), respectively.
Summary: In this paper, we find that numerological superstition is widely used by investors to alleviate the uncertainty concern across financial markets in China. For sophisticated investors, it provides a natural reference to settle the transaction price without causing systemic mispricing. In comparison, for unsophisticated investors, it is associated with overoptimism and provides an indication of overpricing.
Figure 1: Superstition in the stock market
This figure plots the annual probability (vertical axis) of the numbers 4 and 8 in the hundredths place of stock price conditional on that the hundredths place is nonzero. The upper left panel depicts the superstition effect in the stock IPO market; the upper right panel shows the superstition effect in the seasoned equity offering market; the lower left panel shows the superstition effect in the secondary market close price for stocks traded in the Shenzhen exchange; the lower right panel shows the superstition effect in the secondary market close price for stocks traded in Shanghai exchange. The dashed line in the upper left panel marks the date of introduction of a strict IPO price ceiling; the dashed line in both lower panels marks the introduction date of the batched call auction in close price.
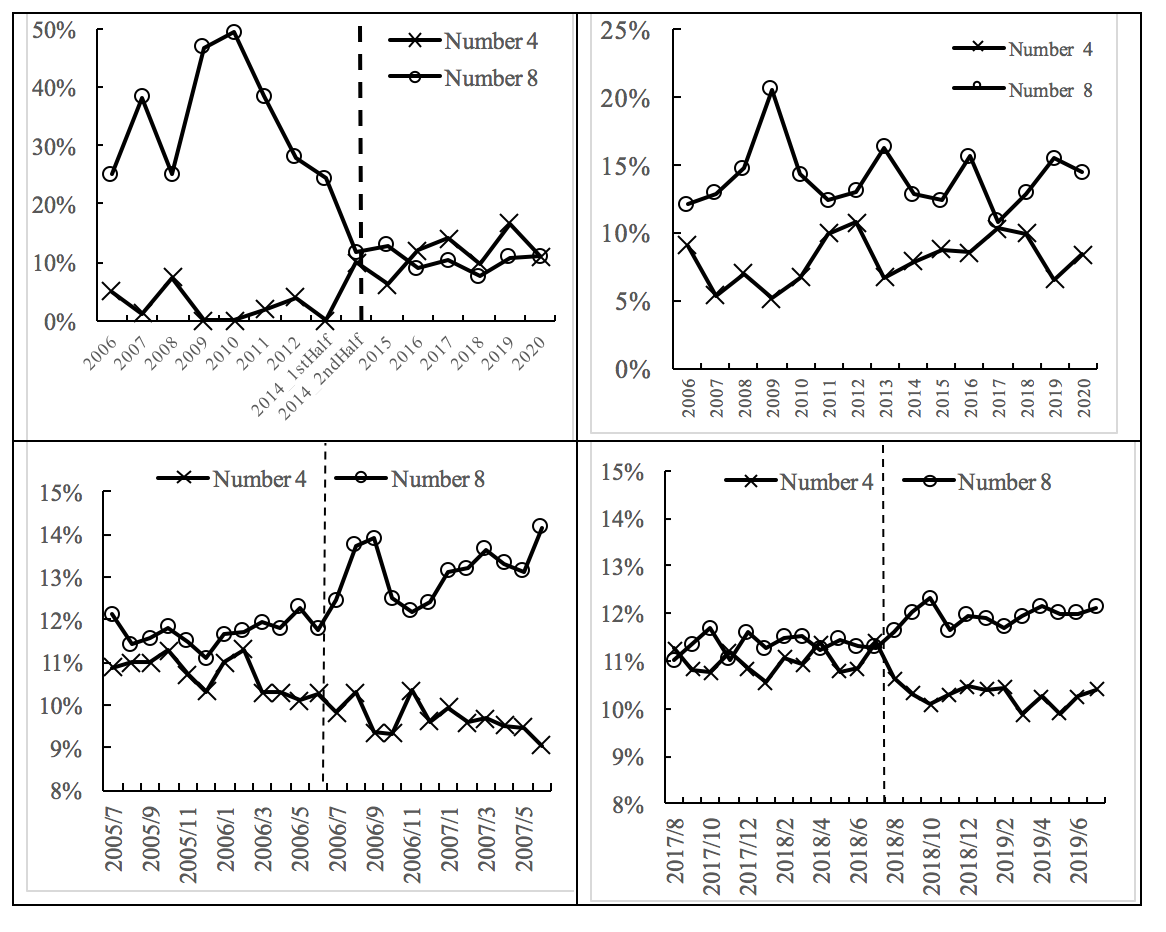
Figure 2: Superstition in the bond market
This figure plots the annual probability (vertical axis) of the numbers 4 and 8 in the hundredths place of the bond coupon rate conditional on that the hundredths digit is nonzero. Each panel depicts the superstition effect for a particular bond type: Treasury Bonds at upper left; National Policy Bank Bonds at upper right; Local Government Bonds at middle left; Financial Bonds at middle right; public Non-Financial Corporate bond at lower left; and private Non-Financial Corporate Bond at lower right.
Footnotes
1. The conditional probability determined by chance.
2. There are only 230 public SEOs from January 1, 1998 to March 31, 2021, compared to 4,752 PEP in the same period. In PEP, the participants must be less than 10. In most of the time, the participants include existing shareholders, suppliers, clients, strategic partners, etc.
3. The close price was originally determined by the weighted average trading prices during the last minute before the last trade. The batched call auction has been used to determine the close price since July 1, 2006 for stocks traded in the SZSE and August 20, 2018 for stocks traded in the SSE. The close price call auction starts at 14:57 pm and ends at 15:00 pm with the same mechanism as the open price call auction. Prior to the introduction of the call auction, the closing price was determined as the volume weighted average of transaction stock prices within the last one-minute time interval before the market closed for the day for both exchanges.
4. For robustness, we have tried different forming period ranges from one day to one month.
5. These bonds are held predominantly by institutional investors. Most will hold the bonds to maturity.
(Jinfan Zhang is an Associate Professor at the School of Management and Economics, the Chinese University of Hong Kong, Shenzhen; Huancheng Du is an Assistant Professor at the School of Finance, Central University of Finance and Economics.)
Reference
Kramer, Thomas, and Lauren G. Block. 2008. “Conscious and Non-Conscious Components of Superstitious Beliefs in Judgment and Decision Making.” Journal of Consumer Research 34 (6):783–93. https://doi.org/10.1086/523288.
Saward, Joe. 2009. “Why There Is No Number 13 in Formula 1.” Joeblogsf1 (blog). December 1, 2009. https://joesaward.wordpress.com/2009/12/01/why-there-is-no-number-13-in-formula-1/.
Chang, Jeffery (Jinfan), and Huancheng Du. 2021. “Superstition Everywhere.” Working paper.
Zhang, Jinfan, Dandan Li, and Huancheng Du. 2020. “Do IPO Pricing Caps Contain New Stock Price? Evidence from the Secondary Market.” Journal of Financial Research 475 (1): 190–206. http://www.jryj.org.cn/EN/volumn/volumn_58.shtml.

Latest
Most Popular
- VoxChina Covid-19 Forum (Second Edition): China’s Post-Lockdown Economic Recovery VoxChina, Apr 18, 2020
- China’s Great Housing Boom Kaiji Chen, Yi Wen, Oct 11, 2017
- China’s Joint Venture Policy and the International Transfer of Technology Kun Jiang, Wolfgang Keller, Larry D. Qiu, William Ridley, Feb 06, 2019
- The Dark Side of the Chinese Fiscal Stimulus: Evidence from Local Government Debt Yi Huang, Marco Pagano, Ugo Panizza, Jun 28, 2017
- Wealth Redistribution in the Chinese Stock Market: the Role of Bubbles and Crashes Li An, Jiangze Bian, Dong Lou, Donghui Shi, Jul 01, 2020
- Evaluating Risk across Chinese Housing Markets Yongheng Deng, Joseph Gyourko, Jing Wu, Aug 02, 2017
- What Is Special about China’s Housing Boom? Edward L. Glaeser, Wei Huang, Yueran Ma, Andrei Shleifer, Jun 20, 2017
- Privatization and Productivity in China Yuyu Chen, Mitsuru Igami, Masayuki Sawada, Mo Xiao, Jan 31, 2018
- Daily Price Limits and the Magnet Effect Ting Chen, Zhenyu Gao, Jibao He, Wenxi Jiang, Wei Xiong, Oct 25, 2017
- How did China Move Up the Global Value Chains? Hiau Looi Kee, Heiwai Tang, Aug 30, 2017


