A Bridge on Economic Issues between China and the World


 Facebook
  Twitter
  Instagram
 WeChat
  Email
Email China’s Import Demand for Agricultural Products: The Impact of the Phase One Trade Agreement

This paper shows that the most efficient way for China to fulfill its committed import purchases from the United States under the Phase One trade agreement is to mimic the effect of an import subsidy. The effective subsidies would divert China’s agricultural imports from other countries. We find that this trade diversion is especially strong for Australia and Canada, followed by Brazil, Indonesia, Malaysia, Thailand, and Vietnam.
In December 2019, the United States and China reached a Phase One agreement to end the trade war. Under this agreement, China committed to purchase $200 billion more imports from the United States in 2020 and 2021, covering products in the manufacturing, agricultural, energy, and services sectors (Bown 2020). While the coronavirus pandemic in 2020 may render this agreement moot or at least delay its implementation, it is still worth asking whether it can ever be achieved. For agricultural goods, the agreement was that China would purchase $12.5 billion more imports from the United States in 2020 and $19.5 billion more imports in 2021 than it had in 2017.
China is among the world’s largest importers of agricultural products despite its large overall trade surplus with the rest of the world. Since joining the WTO in 2001, its agricultural imports increased by more than 12 times between 1997 and 2015 (Figure 1). In 2017, China imported $132 billion of agricultural commodities from the rest of the world, of which $24.1 billion was sourced from the United States. As a result, the Phase One agreement would create an import target of $36.6 billion in 2020 and $43.6 billion in 2021, as shown by the horizontal lines in Figure 1. Since these targets exceed the highest prior values of Chinese agricultural imports from the United States, how can they be achieved?
Figure 1: China’s Agricultural Imports ($ billion) from the United States and the Rest of the World (ROW), 1997–2019
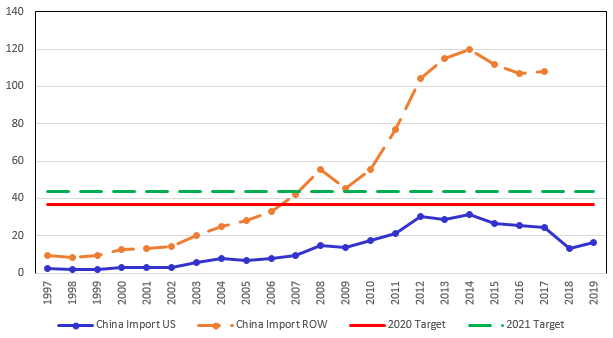
Notes: Data are obtained from China Customs Trade Data, and USDA for 2018 and 2019.
Methodology
To address these questions, Feenstra and Hong (2020) estimate a non-homothetic demand system for agricultural imports into China. We adopt a framework developed by Fajgelbaum and Khandelwal (2016) that combines an almost ideal demand system (AIDS) defined over products and exporting countries with a gravity equation in trade to identify the demand from each importer for the products from each exporter. The data used to estimate the AIDS-gravity equation consist of imports by 30 Chinese provinces for 58 agricultural commodities from 78 major trading partners, over 1997–2017. We are able to distinguish the elasticity of demand by commodity and country of origin with respect to price and income. Based on these key estimated parameters, we forecast China’s future import demand for US agricultural products based on our assumptions about rising spending on imports. Then we ask how China can achieve the 2020 and 2021 import targets.
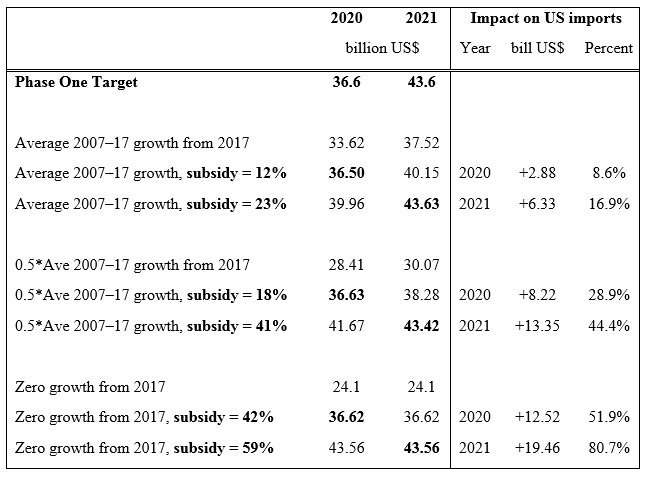
The solution is to mimic the effect of an import subsidy on US importsThe Phase One agreement commits China to a “managed trade” approach to buy more goods and services from the United States during 2020 and 2021. Instead of reducing Chinese tariff or nontariff barriers to boost US exports, quantitative targets are recorded in the Phase One agreement text: for agriculture, China commits to buy $12.5 billion more US imports in 2020 and $19.5 billion more in 2021 than it had in 2017. How should China achieve these targets? Consider a scenario where the Chinese state is able to direct the purchases of agricultural imports to achieve any desired value of imports from the United States, while not changing its total imports from all countries. In this setting, we solve for the optimal imports of each product from each country to achieve the Phase One target at a minimum loss of efficiency. We show that the most efficient way for China to reach the Phase One target with the United States is to mimic the effect of a uniform ad valorem import subsidy on US imports. That is, state agencies could instruct the importers of US agricultural policies to act “as if” there were a subsidy on those goods. Other policies, such as those that required greater purchases of some US crops over others as compared to the uniform subsidy, would create greater efficiency loss. Specifically, if China’s agricultural imports grew at the same annual rate from 2017 as it did during 2007–2017, which is about 10% per year, then we find that the effective subsidies would need to be 12% and 23% to achieve the targets in 2020 and 2021, respectively. If import growth is only one-half of that amount, then the subsidies would need to be 18% and 41%, whereas if, as the result of the coronavirus pandemic, there is no growth from 2017, then the subsidies would need to be as high as 42% and 59% (Table 1). These subsidy rates for US products are admittedly very high, and it would be challenging to achieve that increase in US imports through state command.
Effective subsidy increases Chinese imports from the United States, but diverts from other countries
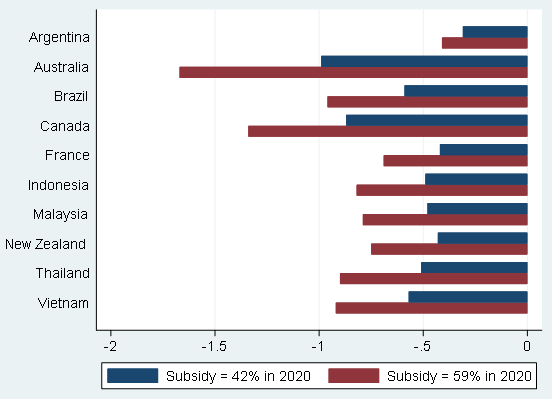
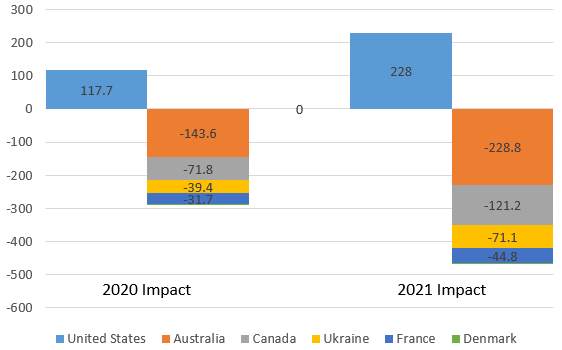
The effective subsidy substantially boosts China’s purchases from the United States. Under the zero-growth scenario, where China’s import demand for each agricultural product is the same as in 2017, the subsidies would lead to increases in US imports of $12.5 and $19.5 billion in 2020 and 2021, respectively, or percentage increases of 51.9% and 80.7% (Table 1). However, increased imports from the United States would result in shifting trade away from the rest of the world by the same amount as a whole, with the diversion of imports being spread across other countries.Among the top ten suppliers after the United States (based on their exports to China in 2017), we find that this trade diversion is especially strong for Australia and Canada, followed by Brazil, Indonesia, Malaysia, Thailand, and Vietnam, and then Argentina, France, Germany, Netherlands, and New Zealand (Figure 2). Australia suffers the largest dollar drop in exports to China of all countries. Its exports to China will fall by $1 billion (or (10.8%) from a baseline of $9.18 billion in 2020, and fall by $1.67 billion (or 18.1%) in 2021. Brazil, the top supplier after the United States, would sell $0.6 billion less to China under a 42% subsidy in 2020 and nearly $1 billion less to China under a 59% subsidy in 2021.
Figure 2: Impact of the Subsidies on Other Countries (US$ billions)
Under the Zero-Growth Scenario
Diversion occurs for three reasons
We show that diversion occurs for three reasons: (i) a conventional substitution effect within products, which depends on the number of competing countries selling each product in each province; (ii) an income effect that arises due to the effective subsidy, which can offset the substitution effect in part or in whole; (iii) a further substitution effect that can occur across products, particularly as some expenditure shares in the AIDS system reach zero so that there is a renormalization of all other demand shares.The combination of three reasons leads to a rich pattern of trade diversion by country
The sources of these export declines by country come from the impact of the subsidies on specific products. For necessity goods (which have a negative income effect), the increase in China’s imports from the United States is less than the decrease in imports from the ROW, such that total imports fall. For example, China reduces its imports of coarse grains from the ROW by more than the increase in its imports from the United States (Figure 3). Since Australia is the major exporter of coarse grains to China, it is hit hard by the effective subsidy to the United States.
Figure 3: Impact of the Subsidies on Coarse Grains (US$ millions)
Under the Zero-Growth Scenario
We find different results for soybeans, which are a luxury good with income elasticity greater than unity. In this case the income effect is so strong that China’s imports from some countries are complementary to those from the United States and therefore rise rather than fall with the Phase One targets. Since Brazil is a principal supplier of soybeans to China in addition to the United States, it experiences a modest impact from the effective subsidies.
Additionally, there can be cross-product substitution away from other products due to the substitution effect. Increased soybean imports from the United States would lower the price of soybean oil for consumers in China, leading to increased demand. That leads to cross-product substitution away from other products—in particular, away from canola oil that is processed from rapeseed. In this way, the effective subsidy on US soybean imports provided to processing plants in China results in less rapeseed imports. Since Canada’s top agricultural export to China is rapeseed, the cross-product drives the decline in China’s rapeseed imports from Canada.
Policy implications
The Trump administration has engaged in numerous trade policy actions with China. The Phase One agreement commits China to a “managed trade” approach by buying $200 billion of US goods and services during 2020 and 2021, over its baseline purchases in 2017. We show that the most efficient way for China to achieve these ambitious targets is to mimic the effect of an import subsidy on US products. The magnitude of these “effective” subsidies on the United States in order to fulfill the Phase One agreement are admittedly very high. It can be expected that the increased imports from the United States would result in the diversion of trade away from the ROW. The impact on different products also shows a rich pattern of trade diversion across source countries due to the Phase One targets. Such a maneuver would violate international trade norms of equal treatment to trading partners, and countries experiencing a fall in their exports to China due to the effective subsidy on the United States would be justified in lodging a complaint with the WTO.
Authors’ note: This research was supported by Cooperative Agreement 58-3000-7-0087 between the U.S. Department of Agriculture’s Economic Research Service and the University of California at Davis. The findings and conclusions in this article are those of the authors and should not be construed to represent any official USDA or US Government determination or policy, nor do they necessarily reflect the views of the National Bureau of Economic Research.
(Robert Feenstra, Department of Economics, University of California, Davis; Chang Hong is an Economist in the Economic Research Service of the U.S. Department of Agriculture.)
References
Feenstra, Robert. and Chang Hong, 2020. “Agricultural Trade and Consumer Demand in China,” NBER Working Paper No. 27383. Available at: https://www.nber.org/papers/w27383
Bown, Chad, 2020. “Unappreciated Hazards of the US-China Phase One Deal,” Trade and Investment Policy Watch, Peterson Institute for International Economics, January 21. Available at: https://www.piie.com/blogs/trade-and-investment-policy-watch/unappreciated-hazards-us-china-phase-one-deal
Fajgelbaum, Pablo D. and Amit K. Khandelwal, 2016. “Measuring the Unequal Gains from Trade,” Quarterly Journal of Economics, 131 (3): 1113–1180.

Latest
Most Popular
- VoxChina Covid-19 Forum (Second Edition): China’s Post-Lockdown Economic Recovery VoxChina, Apr 18, 2020
- China’s Great Housing Boom Kaiji Chen, Yi Wen, Oct 11, 2017
- China’s Joint Venture Policy and the International Transfer of Technology Kun Jiang, Wolfgang Keller, Larry D. Qiu, William Ridley, Feb 06, 2019
- The Dark Side of the Chinese Fiscal Stimulus: Evidence from Local Government Debt Yi Huang, Marco Pagano, Ugo Panizza, Jun 28, 2017
- Wealth Redistribution in the Chinese Stock Market: the Role of Bubbles and Crashes Li An, Jiangze Bian, Dong Lou, Donghui Shi, Jul 01, 2020
- Evaluating Risk across Chinese Housing Markets Yongheng Deng, Joseph Gyourko, Jing Wu, Aug 02, 2017
- What Is Special about China’s Housing Boom? Edward L. Glaeser, Wei Huang, Yueran Ma, Andrei Shleifer, Jun 20, 2017
- Privatization and Productivity in China Yuyu Chen, Mitsuru Igami, Masayuki Sawada, Mo Xiao, Jan 31, 2018
- Daily Price Limits and the Magnet Effect Ting Chen, Zhenyu Gao, Jibao He, Wenxi Jiang, Wei Xiong, Oct 25, 2017
- How did China Move Up the Global Value Chains? Hiau Looi Kee, Heiwai Tang, Aug 30, 2017


