A Bridge on Economic Issues between China and the World


 Facebook
  Twitter
  Instagram
 WeChat
  Email
Email Leverage-Induced Fire Sales and Stock Market Crashes

The authors find that margin investors
heavily sell their holdings when their account-level leverage edges
toward the maximum leverage limits. Stocks that are disproportionately
held by accounts close to leverage limits experience high selling
pressure and abnormal price declines that subsequently reverse over the
next 40 trading days. Unregulated shadow-financed margin accounts
contributed more to the market crash even though these shadow accounts
had higher leverage limits and held a smaller fraction of market assets.
A large body of literature has shown that excessive leverage and the subsequent deleveraging- induced fire sales are considered to be major contributing factors to many past financial crises. Brunnermeier and Pedersen (2009) and Geanakoplos (2010) model a “downward leverage spiral” in which tightened leverage constraints trigger selling by highly levered investors and depress the price further, which triggers even more selling by levered investors and an even lower price. A prominent example is the US stock market crash of 1929. In October 1929, investors began facing margin calls. As investors quickly sold assets to deleverage their positions, the Dow Jones Industrial Average experienced a record loss of 13% on October 28, 1929, known as “Black Monday” (Galbraith, 2009). Other significant examples of deleveraging and market crashes include the US housing crisis, which led to the 2007–08 global financial crisis.
Unfortunately, the existing empirical evidence on fire sales mostly addresses economic forces other than deleveraging. For example, Coval and Stafford (2007) study open-end mutual fund redemptions and the associated non-information-driven sales. In our article, by taking advantage of a unique account-level dataset that tracks hundreds of thousands of margin investors’ borrowing and trading activities, we use the Chinese stock market crash in the summer of 2015 to show direct evidence of fire sales induced by deleveraging pressure.
Our study covers an extraordinary period—from May 2015 to July 2015—during which the Chinese stock market experienced a rollercoaster ride. There are two types of active margin investors during that time. The brokerage margin market is China’s official margin market; similar to the SEC’s setting a uniform initial and maintenance margin for all US brokerage firms, the China Securities Regulation Commission (CSRC) sets constant maximum allowable leverage ratios (called the Pingcang line) that will trigger margin calls for all brokerage firms in China.
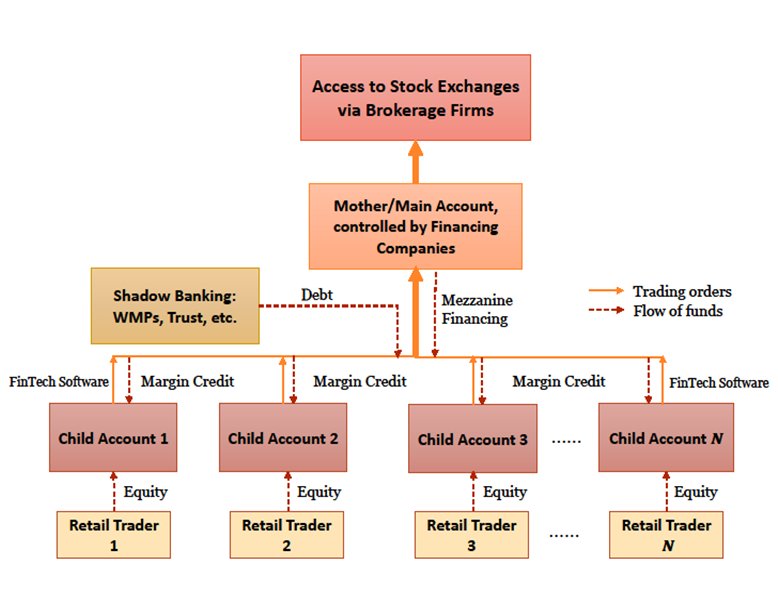
In contrast, the shadow margin market, which has no regulatory rules, provides funding services to investors who cannot meet the brokerage account requirements (for example, a minimum wealth requirement). Shadow financing usually operates through a web-based trading platform that provides various service functions to facilitate trading and borrowing. The typical platform features a “mother-child” dual account structure, as depicted by Figure 1. The mother account (the middle box) is connected to a distinct trading account registered in a brokerage firm with direct access to stock exchanges (the top box). The mother account belongs to the creditor, usually a professional financing company. Each mother account is connected to many (in most cases, hundreds of) child accounts, and each child account is managed by an individual retail margin trader (the bottom boxes).
On the surface, mother accounts appear to be a normal unlevered brokerage accounts, albeit with unusually large asset holdings and trading volume. In reality, these large brokerage accounts are mother accounts that used a FinTech software program to transmit orders submitted by associated child accounts in real time to exchanges. As shown, the professional financing company that manages the mother account provides margin credit to child accounts; its funding sources include its own capital as mezzanine financing as well as borrowing from China’s shadow banking sector (see Figure 2). Through this umbrella-style structure, a creditor can lend funds to multiple margin traders while maintaining different leverage limits for each trader (child account).
A child account also has a Pingcang Line, beyond which the child account is taken over by the mother account (the creditor). Often, this ownership switch is automated through the software system by simply triggering the expiration of the borrower’s password and immediate activation of that of the creditor. Importantly, the Pingcang Lines of shadow accounts are privately negotiated, meaning they have no market-wide regulation.
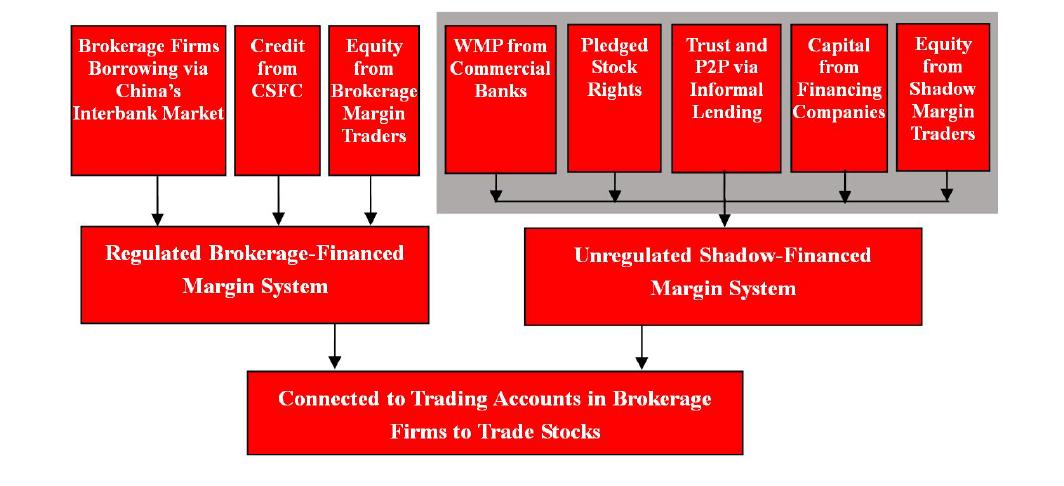
Figure 2 offers a summary of the funding sources for these two margin systems. Unlike in the brokerage margin system, regulators do not know the total shadow market size nor do they know the detailed breakdown of the shadow funding sources.
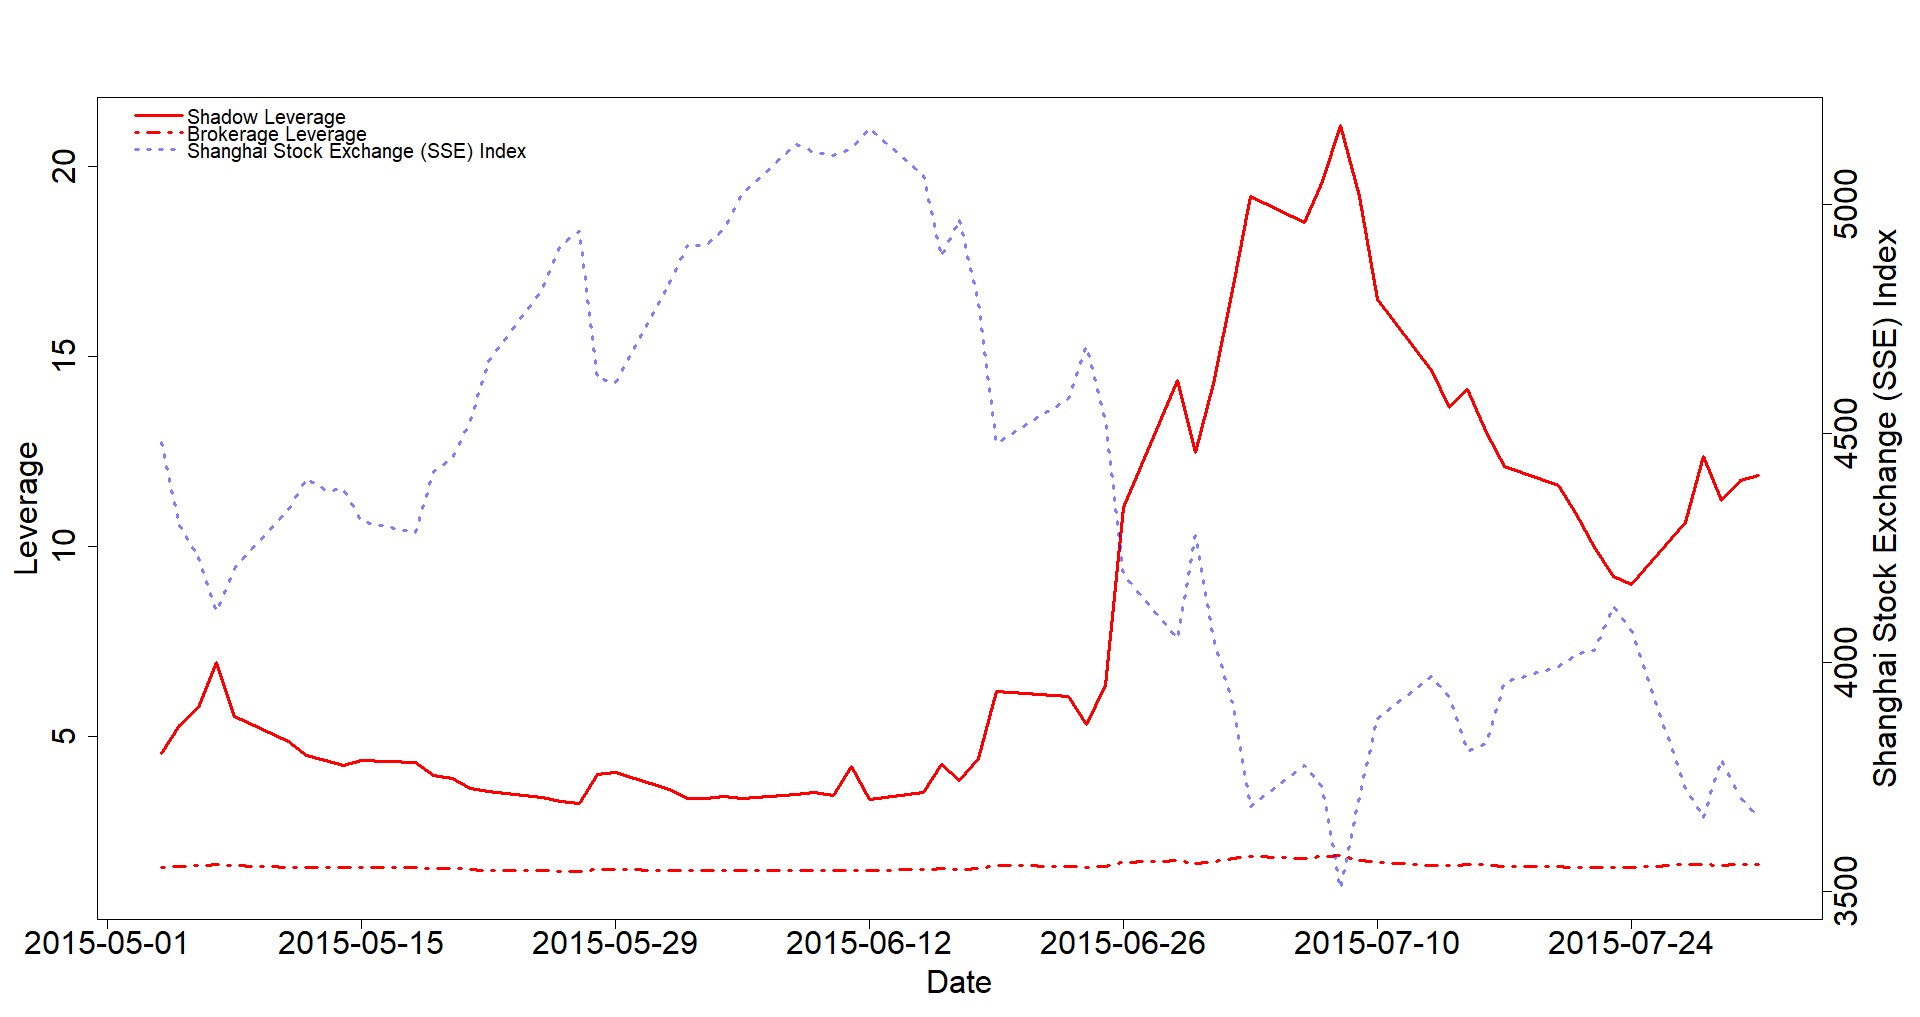
We calculate the daily leverage for each account as account total assets over account equity (defined as assets – debts). Figure 1 plots the asset-weighted leverage ratios for two types of margin accounts with the SSE index from May 2015 to July 2015. The leverage of the shadow accounts fluctuates more dramatically than that of brokerage accounts, with a strong negative correlation with the SSE index.
Fire Sales: Account-Level and Stock-Level Evidence
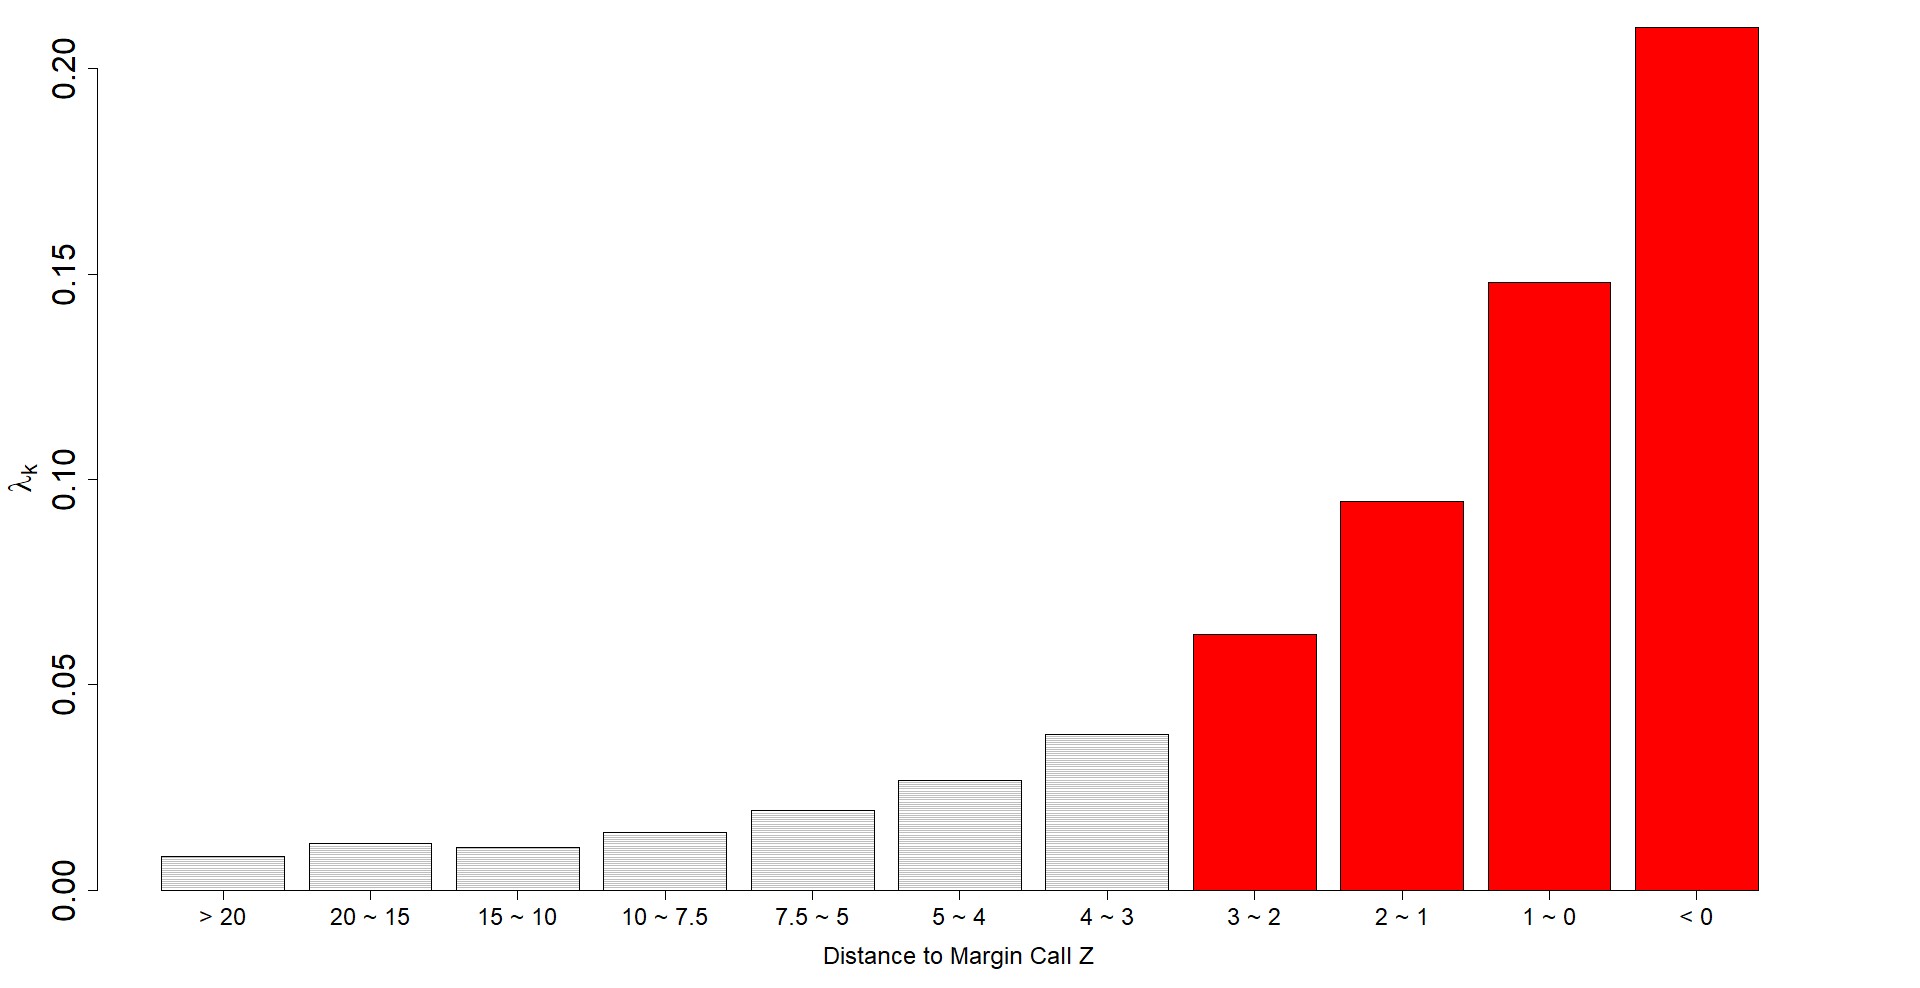
Each day, we construct the Distance-to-Margin-Call (DMC) for each margin account, defined as the distance between the account’s leverage and its Pingcang Line, scaled by the volatility of the account’s stock portfolio. The DMC measure gives the number of standard deviations of downward movements in asset values necessary to push the current leverage up to its Pingcang Line.
The accounts with lower DMCs are more likely to face margin calls and to be subject to high selling pressure. One way to see it is to compare the selling intensities for the same stock on the same day but sitting in accounts with different DMCs; we report the results in Figure 3. Investors begin to intensify their selling when a two-to-three standard deviation return movement would lead to loss of control of their accounts. For this reason, in our study, we refer to accounts with a DMC below 3 as “fire sale accounts.”
Stocks with high fire sale exposure, i.e., stocks that are disproportionately held by those “fire sale accounts,” significantly underperform stocks with low fire sale exposure initially; these differences approach zero in the long run (30 to 40 trading days). This pattern of short-term price impact that reverts in the long run is unique to a “fire sale” story, and is difficult to reconcile with other more canonical explanations.
Regulatory Announcement
On June 12th, 2015, the CSRC released a set of draft rules that explicitly banned new shadow accounts, which had the potential to trigger leverage-induced fire sales. Figure 5 shows the results when we repeat the same exercise as in Figure 4, but based on the sample of 5 days before and after this announcement and separately for the brokerage and shadow accounts. The June 12 regulatory tighten insignificantly increased the selling intensities of shadow accounts within each DMC bin, but the brokerage accounts did not increase very much.
Which Contributed More to the Market Crashes, Shadow or Margin Accounts?
Another relevant policy question is which type of margin accounts, brokerage or shadow, contributed more to the market crash? Our data points to the shadow accounts. Figure 6, Panel A shows that our shadow accounts cover a much smaller portion of the total market capitlalization compared to the brokerage accounts in our sample (See Note 1). However, Panel A offers a misleading picture of how these two types of accounts relate to fire sales. By plotting the fire sale accounts across these two accounts, Panel B delivers a completely opposite message. Compared to brokerage system, there is a much higher proportion of stock market capitalization held by shadow fire sale accounts. What is more, a measure of fire sale exposure constructed from the shadow accounts predicts price declines and subsequent reversals much more strongly than that constructed from the brokerage accounts.
Conclusion
Our paper uses unique account-level data for brokerage-financed and shadow-financed margin traders in the Chinese stock market to study the role of deleveraging and fire sales in the Chinese stock market crash in the summer of 2015. We show that margin investors heavily sell their holdings when they edge toward their funding constraints. This selling pressure causes stocks that are disproportionately held by investors who are close to receiving margin calls to be exposed to fire sale risk, especially during periods when the market is in rapid decline. Consistent with this view, we show that stocks with greater fire sale risk exposure experience larger abnormal price declines relative to stocks with lower fire sale risk. In a companion study, Bian et al (2018a) show that how this (de)leverage-induced action may lead to idiosyncratic risks being transferred across stocks. Taken together, these two studies quantitatively evaluate the impact on the stock market from the deleveraging selling activities.
Note 1: Our sample covers about 5% of the actual size for each margin account. As a result, the relative asset sizes of the two account types shown in Panel A roughly reflect their relative asset holdings in the entire market.
Bian, Jiangze, Zhi Da, Dong Lou, and Hao Zhou, 2018a, Leverage network and market contagion, Working paper. http://personal.lse.ac.uk/loud/Leverage.pdf
Bian, Jiangze, Zhiguo He, Kelly Shue, and Hao Zhou, 2018b, Leverage-Induced fire sales and stock market crashes, Working paper.
http://www.zhiguohe.com/uploads/1/0/6/9/106923057/fse-draft-20180906_ks.pdf
Brunnermeier, Markus, and Lasse Pedersen, 2009, Market liquidity and funding liquidity, Review of Financial Studies, 22, 2201-2238. https://scholar.princeton.edu/sites/default/files/liquidity.pdf
Coval, Joshua, and Erik Stafford, 2007, Asset fire sales (and purchases) in equity markets, Journal of Financial Economics 86, 479-512. http://www.people.hbs.edu/estafford/Papers/AFS.pdf
Galbraith, J. Kenneth, 2009, The Great Crash 1929 (Houghton Mifflin, New York, NY).
https://www.amazon.com/Great-Crash-1929-Kenneth-Galbraith/dp/0547248164
Geanakoplos, John, 2010, The leverage cycles, NBER Macroeconomic Annual 24, 1-66.
A large body of literature has shown that excessive leverage and the subsequent deleveraging- induced fire sales are considered to be major contributing factors to many past financial crises. Brunnermeier and Pedersen (2009) and Geanakoplos (2010) model a “downward leverage spiral” in which tightened leverage constraints trigger selling by highly levered investors and depress the price further, which triggers even more selling by levered investors and an even lower price. A prominent example is the US stock market crash of 1929. In October 1929, investors began facing margin calls. As investors quickly sold assets to deleverage their positions, the Dow Jones Industrial Average experienced a record loss of 13% on October 28, 1929, known as “Black Monday” (Galbraith, 2009). Other significant examples of deleveraging and market crashes include the US housing crisis, which led to the 2007–08 global financial crisis.
Unfortunately, the existing empirical evidence on fire sales mostly addresses economic forces other than deleveraging. For example, Coval and Stafford (2007) study open-end mutual fund redemptions and the associated non-information-driven sales. In our article, by taking advantage of a unique account-level dataset that tracks hundreds of thousands of margin investors’ borrowing and trading activities, we use the Chinese stock market crash in the summer of 2015 to show direct evidence of fire sales induced by deleveraging pressure.
Our study covers an extraordinary period—from May 2015 to July 2015—during which the Chinese stock market experienced a rollercoaster ride. There are two types of active margin investors during that time. The brokerage margin market is China’s official margin market; similar to the SEC’s setting a uniform initial and maintenance margin for all US brokerage firms, the China Securities Regulation Commission (CSRC) sets constant maximum allowable leverage ratios (called the Pingcang line) that will trigger margin calls for all brokerage firms in China.
In contrast, the shadow margin market, which has no regulatory rules, provides funding services to investors who cannot meet the brokerage account requirements (for example, a minimum wealth requirement). Shadow financing usually operates through a web-based trading platform that provides various service functions to facilitate trading and borrowing. The typical platform features a “mother-child” dual account structure, as depicted by Figure 1. The mother account (the middle box) is connected to a distinct trading account registered in a brokerage firm with direct access to stock exchanges (the top box). The mother account belongs to the creditor, usually a professional financing company. Each mother account is connected to many (in most cases, hundreds of) child accounts, and each child account is managed by an individual retail margin trader (the bottom boxes).
On the surface, mother accounts appear to be a normal unlevered brokerage accounts, albeit with unusually large asset holdings and trading volume. In reality, these large brokerage accounts are mother accounts that used a FinTech software program to transmit orders submitted by associated child accounts in real time to exchanges. As shown, the professional financing company that manages the mother account provides margin credit to child accounts; its funding sources include its own capital as mezzanine financing as well as borrowing from China’s shadow banking sector (see Figure 2). Through this umbrella-style structure, a creditor can lend funds to multiple margin traders while maintaining different leverage limits for each trader (child account).
Figure 1: Structure of Shadow-Financed System the Prevailed in the Chinese Stock Market in 2015
A child account also has a Pingcang Line, beyond which the child account is taken over by the mother account (the creditor). Often, this ownership switch is automated through the software system by simply triggering the expiration of the borrower’s password and immediate activation of that of the creditor. Importantly, the Pingcang Lines of shadow accounts are privately negotiated, meaning they have no market-wide regulation.
Figure 2 offers a summary of the funding sources for these two margin systems. Unlike in the brokerage margin system, regulators do not know the total shadow market size nor do they know the detailed breakdown of the shadow funding sources.
Figure 2: Funding Sources for the Brokerage- and Shadow-Financed Margin Systems in the Chinese Stock Market
We calculate the daily leverage for each account as account total assets over account equity (defined as assets – debts). Figure 1 plots the asset-weighted leverage ratios for two types of margin accounts with the SSE index from May 2015 to July 2015. The leverage of the shadow accounts fluctuates more dramatically than that of brokerage accounts, with a strong negative correlation with the SSE index.
Figure 3: Asset-weighted Leverage, Brokerage vs. Shadow Accounts
Fire Sales: Account-Level and Stock-Level Evidence
Each day, we construct the Distance-to-Margin-Call (DMC) for each margin account, defined as the distance between the account’s leverage and its Pingcang Line, scaled by the volatility of the account’s stock portfolio. The DMC measure gives the number of standard deviations of downward movements in asset values necessary to push the current leverage up to its Pingcang Line.
The accounts with lower DMCs are more likely to face margin calls and to be subject to high selling pressure. One way to see it is to compare the selling intensities for the same stock on the same day but sitting in accounts with different DMCs; we report the results in Figure 3. Investors begin to intensify their selling when a two-to-three standard deviation return movement would lead to loss of control of their accounts. For this reason, in our study, we refer to accounts with a DMC below 3 as “fire sale accounts.”
Figure 4: Coefficients by Regressing Account Net Selling of Stock Shares on Previous Day’s Distance to Margin Call Dummies
Stocks with high fire sale exposure, i.e., stocks that are disproportionately held by those “fire sale accounts,” significantly underperform stocks with low fire sale exposure initially; these differences approach zero in the long run (30 to 40 trading days). This pattern of short-term price impact that reverts in the long run is unique to a “fire sale” story, and is difficult to reconcile with other more canonical explanations.
Regulatory Announcement
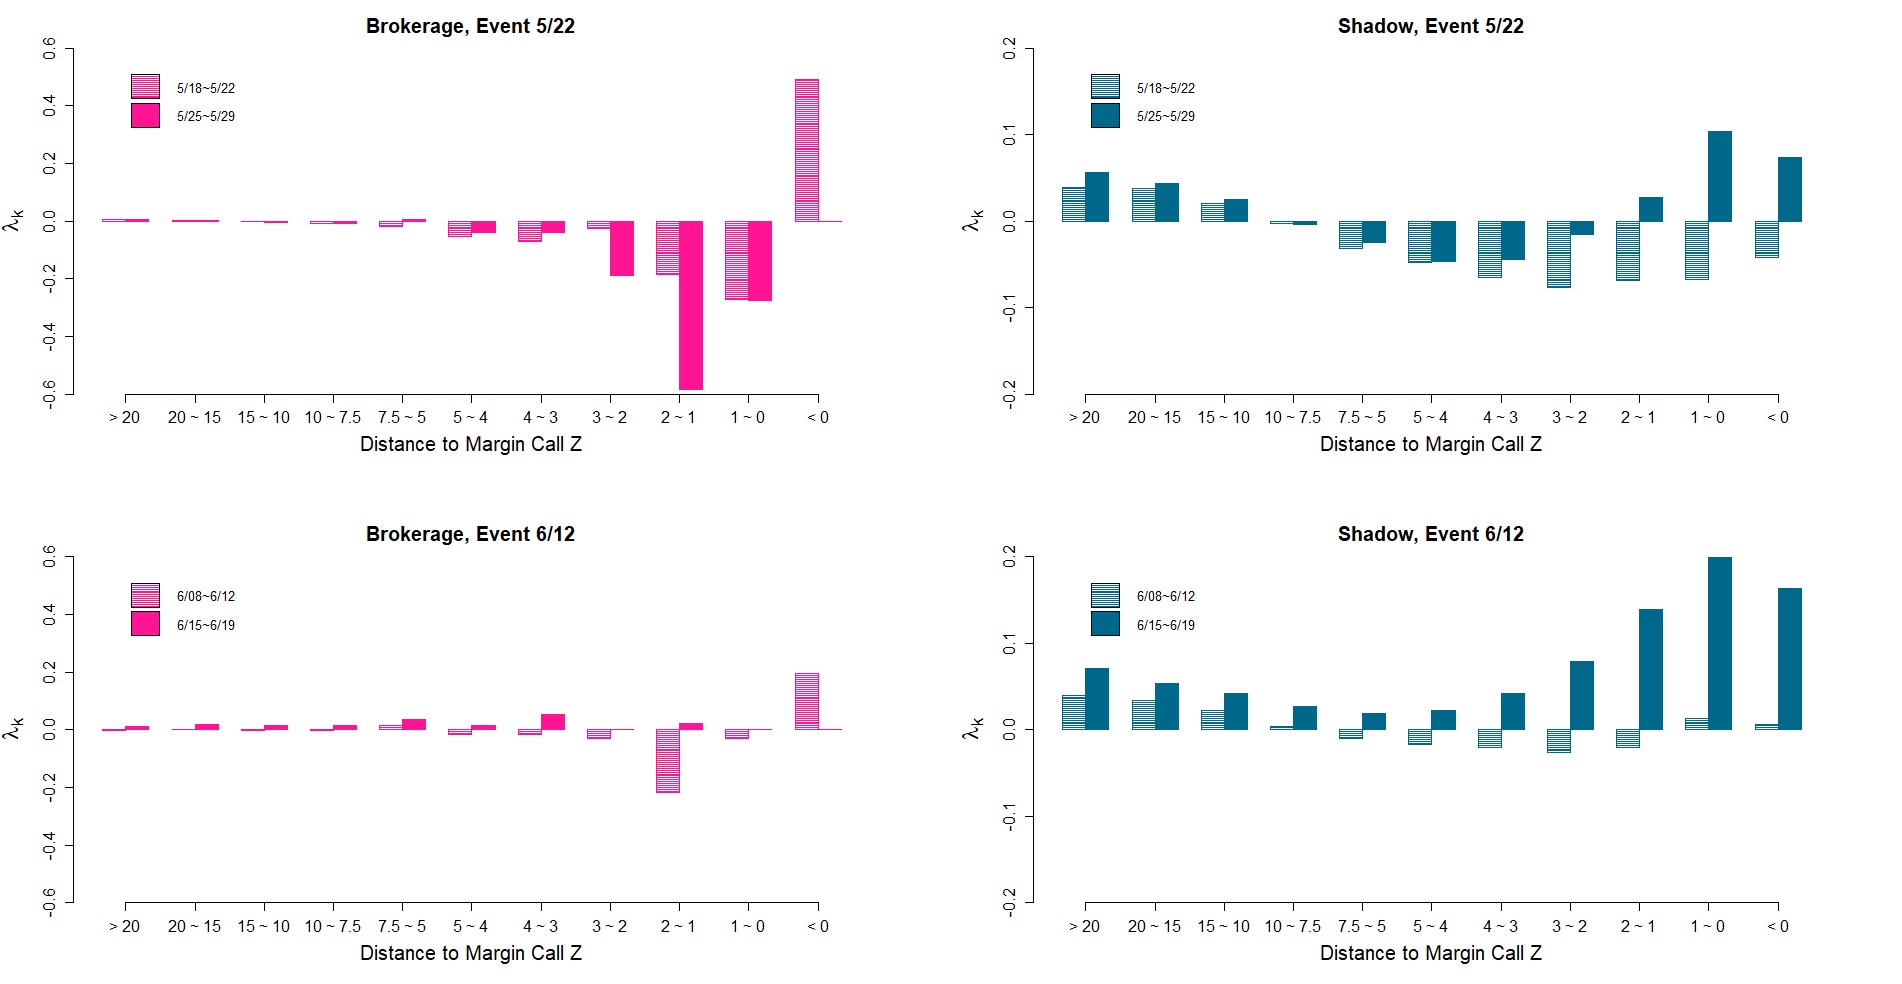
On June 12th, 2015, the CSRC released a set of draft rules that explicitly banned new shadow accounts, which had the potential to trigger leverage-induced fire sales. Figure 5 shows the results when we repeat the same exercise as in Figure 4, but based on the sample of 5 days before and after this announcement and separately for the brokerage and shadow accounts. The June 12 regulatory tighten insignificantly increased the selling intensities of shadow accounts within each DMC bin, but the brokerage accounts did not increase very much.
Figure 5: This Figure Plots the Coefficients from Regression in Figure 4, Estimated Separately for the Brokerage and Shadow Accounts for the Five Trading Days Before and After June 12, 2015
Which Contributed More to the Market Crashes, Shadow or Margin Accounts?
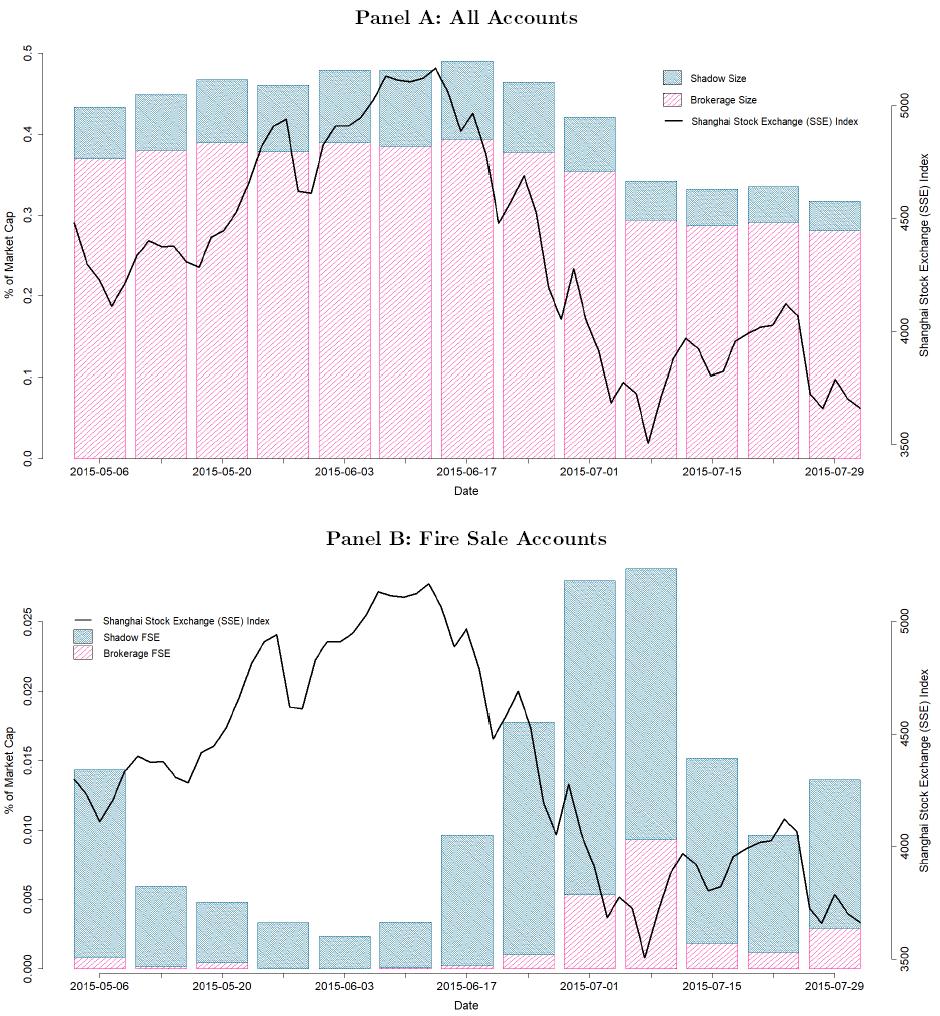
Another relevant policy question is which type of margin accounts, brokerage or shadow, contributed more to the market crash? Our data points to the shadow accounts. Figure 6, Panel A shows that our shadow accounts cover a much smaller portion of the total market capitlalization compared to the brokerage accounts in our sample (See Note 1). However, Panel A offers a misleading picture of how these two types of accounts relate to fire sales. By plotting the fire sale accounts across these two accounts, Panel B delivers a completely opposite message. Compared to brokerage system, there is a much higher proportion of stock market capitalization held by shadow fire sale accounts. What is more, a measure of fire sale exposure constructed from the shadow accounts predicts price declines and subsequent reversals much more strongly than that constructed from the brokerage accounts.
Figure 6: Panel A (B): Total Market Capitalization Held in All (fire sale) Brokerage and Shadow Accounts in our Sample
Conclusion
Our paper uses unique account-level data for brokerage-financed and shadow-financed margin traders in the Chinese stock market to study the role of deleveraging and fire sales in the Chinese stock market crash in the summer of 2015. We show that margin investors heavily sell their holdings when they edge toward their funding constraints. This selling pressure causes stocks that are disproportionately held by investors who are close to receiving margin calls to be exposed to fire sale risk, especially during periods when the market is in rapid decline. Consistent with this view, we show that stocks with greater fire sale risk exposure experience larger abnormal price declines relative to stocks with lower fire sale risk. In a companion study, Bian et al (2018a) show that how this (de)leverage-induced action may lead to idiosyncratic risks being transferred across stocks. Taken together, these two studies quantitatively evaluate the impact on the stock market from the deleveraging selling activities.
Note 1: Our sample covers about 5% of the actual size for each margin account. As a result, the relative asset sizes of the two account types shown in Panel A roughly reflect their relative asset holdings in the entire market.
(Jiangze Bian, University of International Business and Economics; Zhiguo He, University of Chicago, Booth School of Business, and NBER; Kelly Shue, Yale University, School of Management, and NBER; Hao Zhou, PBC School of Finance, Tsinghua University.)
Bian, Jiangze, Zhi Da, Dong Lou, and Hao Zhou, 2018a, Leverage network and market contagion, Working paper. http://personal.lse.ac.uk/loud/Leverage.pdf
Bian, Jiangze, Zhiguo He, Kelly Shue, and Hao Zhou, 2018b, Leverage-Induced fire sales and stock market crashes, Working paper.
http://www.zhiguohe.com/uploads/1/0/6/9/106923057/fse-draft-20180906_ks.pdf
Brunnermeier, Markus, and Lasse Pedersen, 2009, Market liquidity and funding liquidity, Review of Financial Studies, 22, 2201-2238. https://scholar.princeton.edu/sites/default/files/liquidity.pdf
Coval, Joshua, and Erik Stafford, 2007, Asset fire sales (and purchases) in equity markets, Journal of Financial Economics 86, 479-512. http://www.people.hbs.edu/estafford/Papers/AFS.pdf
Galbraith, J. Kenneth, 2009, The Great Crash 1929 (Houghton Mifflin, New York, NY).
https://www.amazon.com/Great-Crash-1929-Kenneth-Galbraith/dp/0547248164
Geanakoplos, John, 2010, The leverage cycles, NBER Macroeconomic Annual 24, 1-66.
https://www.nber.org/chapters/c11786.pdf

Latest
Most Popular
- VoxChina Covid-19 Forum (Second Edition): China’s Post-Lockdown Economic Recovery VoxChina, Apr 18, 2020
- China’s Great Housing Boom Kaiji Chen, Yi Wen, Oct 11, 2017
- China’s Joint Venture Policy and the International Transfer of Technology Kun Jiang, Wolfgang Keller, Larry D. Qiu, William Ridley, Feb 06, 2019
- The Dark Side of the Chinese Fiscal Stimulus: Evidence from Local Government Debt Yi Huang, Marco Pagano, Ugo Panizza, Jun 28, 2017
- Wealth Redistribution in the Chinese Stock Market: the Role of Bubbles and Crashes Li An, Jiangze Bian, Dong Lou, Donghui Shi, Jul 01, 2020
- Evaluating Risk across Chinese Housing Markets Yongheng Deng, Joseph Gyourko, Jing Wu, Aug 02, 2017
- What Is Special about China’s Housing Boom? Edward L. Glaeser, Wei Huang, Yueran Ma, Andrei Shleifer, Jun 20, 2017
- Privatization and Productivity in China Yuyu Chen, Mitsuru Igami, Masayuki Sawada, Mo Xiao, Jan 31, 2018
- Daily Price Limits and the Magnet Effect Ting Chen, Zhenyu Gao, Jibao He, Wenxi Jiang, Wei Xiong, Oct 25, 2017
- How did China Move Up the Global Value Chains? Hiau Looi Kee, Heiwai Tang, Aug 30, 2017


