A Bridge on Economic Issues between China and the World


 Facebook
  Twitter
  Instagram
 WeChat
  Email
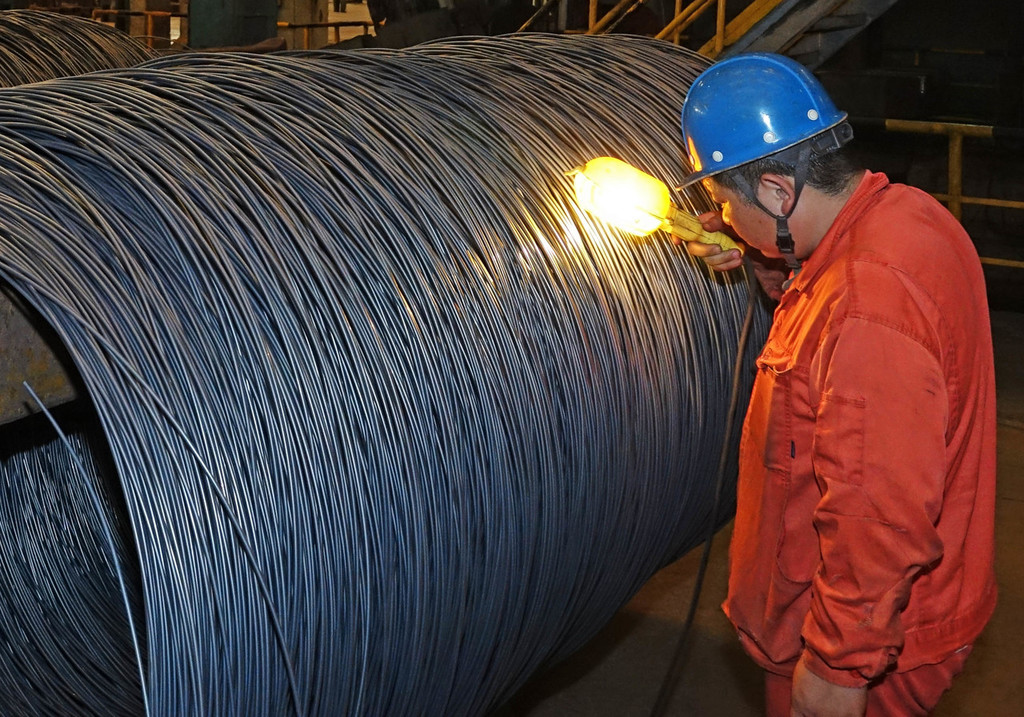
Email China’s Producer Price Reflation in 2016–2017: Capacity Cuts or Recovering Aggregate Demand?

In late 2015, the Chinese government
launched a multi-year plan to reduce capacity in the coal and steel
industries. Around the same time, producer price inflation in China
started to pick up strongly after being trapped in negative territory
for 4½ years. What is behind this broad reflation—cuts in coal and steel
capacity or a strengthening of aggregate demand? Our analyses indicate
that a pickup in aggregate demand, possibly due to the government’s
stimulus package in 2015–2016, was the more important driver of the
broad reflation. Capacity cuts played a role in propping up coal and
steel prices but explain, at most, 40 percent of their price increase.
In late 2015, China launched a capacity reduction policy under the wider effort of supply-side structural reforms that aimed to address structural imbalances in the Chinese economy and guide the transition toward the “new normal” of lowerspeed but higherquality growth. Specifically, the capacity reduction reform targeted steel and coal, two industries that have experienced rapid expansion, especially during the massive 2009 economic stimulus, and has more recently seen a steady decline in capacity utilization.
Context: China’s Policy to Cut Capacity and Producer Prices
For years, China’s investment-driven growth model led to persistently strong demand for commodities and heavyindustry products, thus fostering substantial capital investments in the industrial sector. From 1996 to 2010, the country’s steel production increased by more than six-fold from around 100 million metric tons to 627 million tons, and its share in global steel production rose from 13.5 percent to 44.3 percent. China’s coal production grew by 3.9 percent per year in 2006–15, compared to the global rate of 2.5 percent, and the country accounted for 47 percent of global coal production in 2015, with a total production of 1.8 billion tons (BP 2017). China’s excess industrial capacity also became a source of tension internationally, prompting a call in a G20 Summit for member countries to take actions to foster “a level playing field in the global steel industry” in 2015.
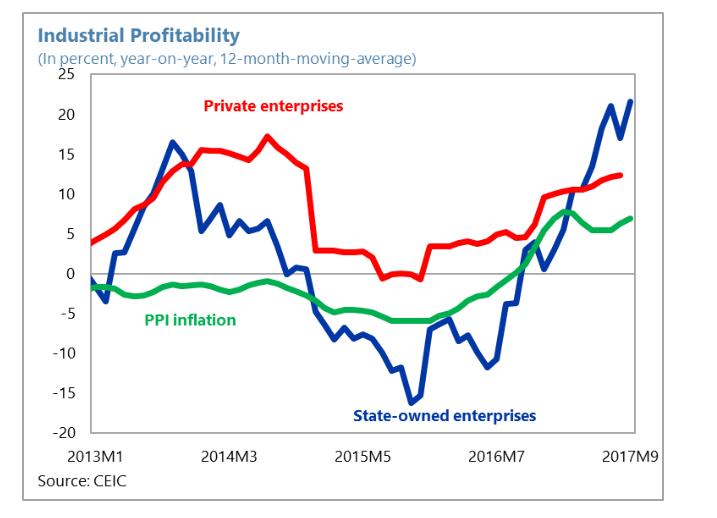
As GDP growth started to decline in China after 2010, capacity utilization in the steel and coal industries contracted from around 80 percent and 90 percent in 2010, respectively, to less than 70 percent and 65 percent in 2015. Falling capacity utilization was accompanied by a sizable deterioration in corporate profitability and debt-servicing capacity. By the end of 2015, the coal and steel industries accounted for 14 percent of corporate debt in China’s industrial sector. It would take 91 years and 74 years, respectively, for the coal and ferrous metal smelting (including steel) industries to pay back total debts at their current cash flow generation levels, compared to the industrial sector average of under 10 years (EIU 2017).
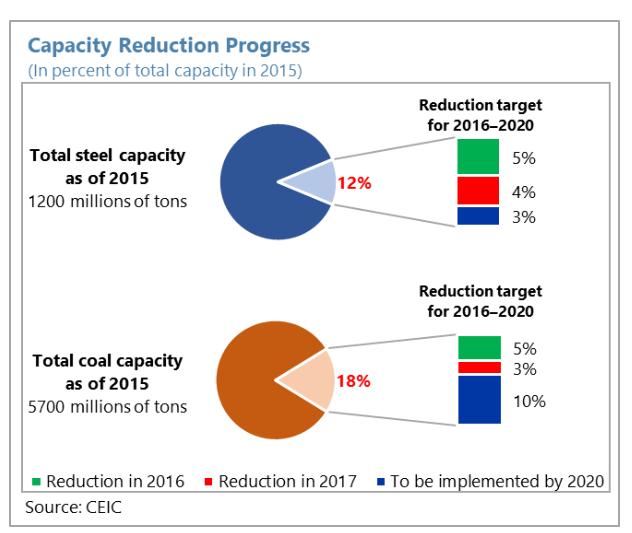
The capacity reduction reform announced in late 2015 set ambitious targets to reduce steel capacity by 100–150 million tons (about 8–12 percent of 2015 year-end capacity) and coal capacity by 1 billion tons (about 20 percent of 2015 year-end capacity) within three to five years. According to published data, China is likely to achieve these goals well ahead of schedule. Steel capacity was curbed by 115 million tons in 2016–2017, more than 75 percent of the 5-year target, and coal capacity was reduced by more than 290 million tons in 2016 and another 150 million tons in 2017. With the significant capacity cuts, capacity utilization ratios and profitability improved markedly in both industries.
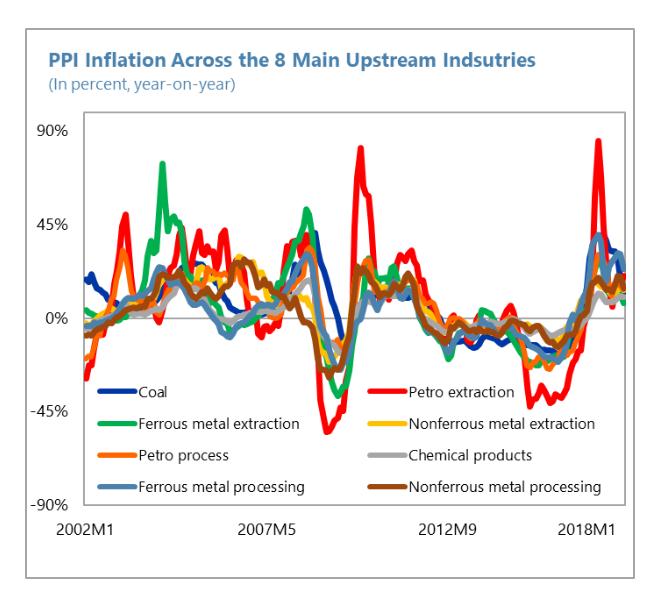
Perhaps more interestingly, the steady reduction in steel and coal capacity was accompanied by not only a pickup in domestic steel and coal prices but also broad-based reflation of industrial prices in China. Producer price index (PPI) inflation, turned positive in September 2015 and has remained robust since, after being trapped in negative territory for 54 months. This has in turn led to improved corporate revenues and profits including the steel and coal industries. Although the PPI reflation was broad-based, it is natural to draw the connection between rising industrial prices and capacity cuts, which reduced competitive pressures in steel and coal production and led to higher prices of steel and coal, two important inputs for many industrial sectors. Indeed, encouraged by the impact of steel and coal capacity reduction, the Chinese government planned to expand the reform to more industries including cement, electrolyzed aluminum, flat glass, and coal-fired power plants.
However, rising prices are not necessarily only due to reduced capacity. Actual production in metals processing and coal remained strong. Crude steel production, for instance, grew by 1.2 percent in 2016 and another 5.7 percent in 2017. The improvement in corporate profitability since 2015 has been more significant in upstream industries than downstream, which is an indication that higher coal and steel prices may not have been fully transmitted to prices of other industrial products. Moreover, 2016 saw a rapid recovery in aggregate demand, particularly compared to 2015, in which economic indicators had been particularly weak.
Separating the Impact of Capacity Cuts from Aggregate Demand
In Chen, Ding, and Mano (2018) we find that a general recovery in aggregate demand, thanks to the government’s stimulus policies in 2015–2016, was likely a more important driver of China’s PPI reflation.
While capacity reduction has certainly played a role in propping up producer prices in steel and coal, it does not explain the broad-based reflation that touched other upstream industries whose production is not directly linked to steel or coal.
Eight upstream industries, including steel and coal, dominate the dynamics of China’s PPI. We first investigate the impact of capacity cuts in a panel setting by comparing price movements of the targeted industries (steel and coal) to those of the other six upstream industries while controlling for demand from downstream industries, which could drive price movements. To properly capture demand and yet remain parsimonious, we exploit a large number of variables that represent downstream demand and extract common demand factors. The top three common factors together explain around 70 percent of the variations of a set of 40 demand variables. They capture well the strengthening of demand after mid-2015, as the government implemented stimulus measures, which included boosting infrastructure spending, credit expansion, and housing market policies in response to the earlier growth slowdown. The strong pickup in housing market activity, for instance, had a direct impact on the demand for construction materials including steel.
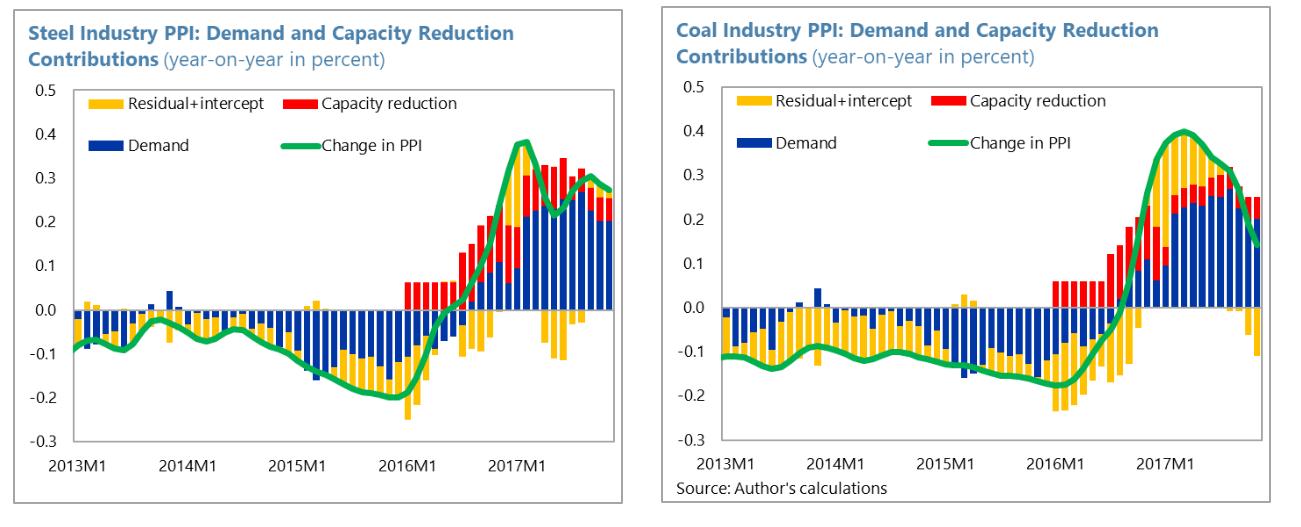
Having estimated factors that capture demand conditions, we run a panel regression of the drivers of PPI, where we evaluate whether capacity cuts in steel and coal, measured as the actual capacity reduction relative to 2015 year-end capacity, had a statistically significant impact on producer prices. Capacity reduction efforts were indeed important in propping up steel and coal prices, representing about 34 and 25 of the change in PPI in 2016–2017, while demand factors represent 63 and 59 percent respectively, with the regression residuals accounting for the rest. Importantly, the PPI reflation in other upstream industries not subject to capacity reduction is explained by common demand factors.
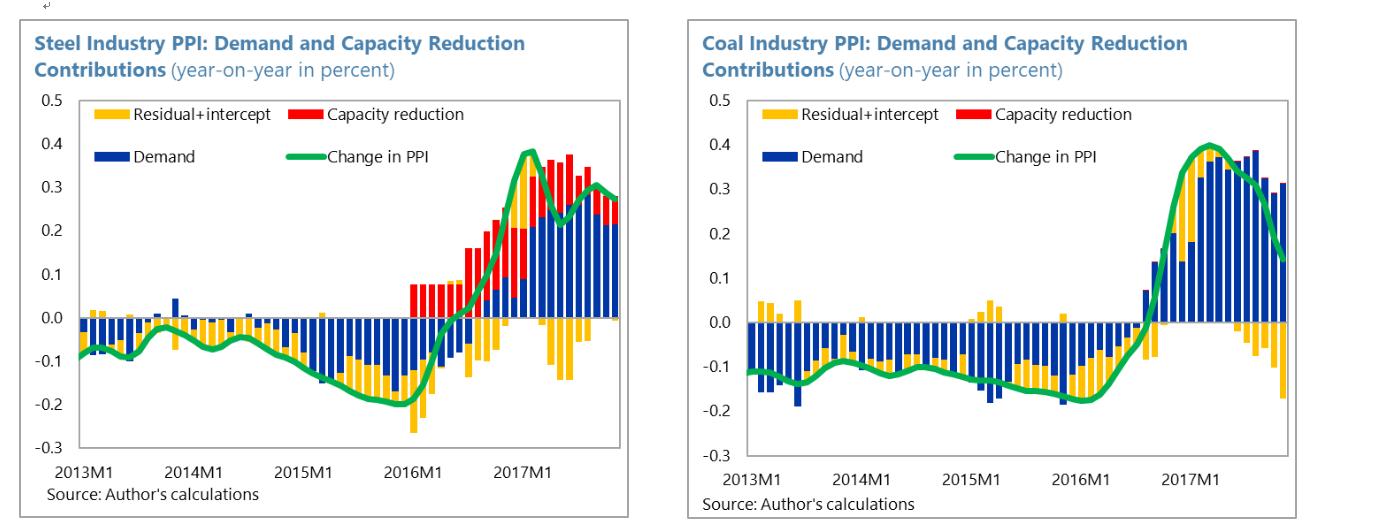
To complement the panel analysis, we also conducted a time series analysis to examine the drivers of coal and steel prices separately. The individual sector regressions attribute an important role to capacity reduction efforts in steel but not for coal. For the steel industry, we find that demand still explains a substantial fraction of steel price movements (58 percent), while capacity cuts account for 42 percent, larger than in the panel regression. However, for the coal industry, we find that demand factors account for the full shift in PPI inflation in the sector, with capacity reduction becoming insignificant.
Final Thoughts
The pickup in aggregate demand likely reflected policies implemented in 2015–2016 to boost infrastructure investment and housing sector activities. Destocking in the residential housing market, for instance, contributed to a resurgence in housing prices and sales particularly in China’s smaller cities since 2015, until the government significantly tightened housing market policies to contain the house price bubble. There was a large increase in public sector infrastructure investment in 2016. Finally, tax cuts also may have played a role in boosting demand in downstream industries that supported upstream prices, such as the tax cut on vehicle purchases and a reduction in business taxes. Thus, the full package of stimulus policies seems to have been important.
Rising steel and coal prices also pushed up costs of downstream industries, including electricity generation, real estate, and manufacturing, and could just be a transfer without net positive welfare impacts. In this regard, the strong pickup in aggregate demand was important to mitigate the impact of surging steel and coal prices on the downstream industries. Without it, this would have hurt industries that use coal and steel as inputs, and would have been a transfer of resources to those two industries. Fortunately, strong demand allowed downstream industries (and other upstream industries) to also raise their prices.
A fuller cost-benefit analysis is outside of the scope of this paper but would be desirable if the government decides to expand capacity cuts to other industries. Supporting prices is a necessary condition for capacity cuts to have an overall positive welfare impact. But it is not sufficient, as capacity cuts alone can be simply a transfer, both within the intervened industries (from targeted firms to unaffected ones) and between intervened and non-intervened industries, and thus may not generate aggregate efficiency gains.
This article is based on Chen, L., Ding, D. and R. C. Mano, “China’s Capacity Reduction Reform and Its Impact on Producer Prices,” IMF Working Paper No. 18/216. The views expressed in IMF Working Papers are those of the authors and do not necessarily represent the views of the IMF, its Executive Board, or IMF management.
(Linxi Chen was a PhD student at Duke University at the time the working paper was written. Ding Ding and Rui Mano are economists at the International Monetary Fund.)
BP, 2017. Statistical Review of World Energy 2017. British Petroleum, London.
https://www.bp.com/en/global/corporate/energy-economics/statistical-review-of-world-energy/downloads.html
Chen, L, Ding, D. and R. C. Mano, “China’s Capacity Reduction Reform and Its Impact on Producer Prices,” IMF Working Paper No. 18/216.
https://www.imf.org/en/Publications/WP/Issues/2018/09/28/Chinas-Capacity-Reduction-Reform-and-Its-Impact-on-Producer-Prices-46223
EIU, 2017. China’s Supply-Side Structural Reforms: Progress and Outlook. Intelligence Unit, the Economist.
https://www.eiu.com/public/topical_report.aspx?campaignid=ChinaSSSR2017
In late 2015, China launched a capacity reduction policy under the wider effort of supply-side structural reforms that aimed to address structural imbalances in the Chinese economy and guide the transition toward the “new normal” of lowerspeed but higherquality growth. Specifically, the capacity reduction reform targeted steel and coal, two industries that have experienced rapid expansion, especially during the massive 2009 economic stimulus, and has more recently seen a steady decline in capacity utilization.
Context: China’s Policy to Cut Capacity and Producer Prices
For years, China’s investment-driven growth model led to persistently strong demand for commodities and heavyindustry products, thus fostering substantial capital investments in the industrial sector. From 1996 to 2010, the country’s steel production increased by more than six-fold from around 100 million metric tons to 627 million tons, and its share in global steel production rose from 13.5 percent to 44.3 percent. China’s coal production grew by 3.9 percent per year in 2006–15, compared to the global rate of 2.5 percent, and the country accounted for 47 percent of global coal production in 2015, with a total production of 1.8 billion tons (BP 2017). China’s excess industrial capacity also became a source of tension internationally, prompting a call in a G20 Summit for member countries to take actions to foster “a level playing field in the global steel industry” in 2015.
As GDP growth started to decline in China after 2010, capacity utilization in the steel and coal industries contracted from around 80 percent and 90 percent in 2010, respectively, to less than 70 percent and 65 percent in 2015. Falling capacity utilization was accompanied by a sizable deterioration in corporate profitability and debt-servicing capacity. By the end of 2015, the coal and steel industries accounted for 14 percent of corporate debt in China’s industrial sector. It would take 91 years and 74 years, respectively, for the coal and ferrous metal smelting (including steel) industries to pay back total debts at their current cash flow generation levels, compared to the industrial sector average of under 10 years (EIU 2017).
The capacity reduction reform announced in late 2015 set ambitious targets to reduce steel capacity by 100–150 million tons (about 8–12 percent of 2015 year-end capacity) and coal capacity by 1 billion tons (about 20 percent of 2015 year-end capacity) within three to five years. According to published data, China is likely to achieve these goals well ahead of schedule. Steel capacity was curbed by 115 million tons in 2016–2017, more than 75 percent of the 5-year target, and coal capacity was reduced by more than 290 million tons in 2016 and another 150 million tons in 2017. With the significant capacity cuts, capacity utilization ratios and profitability improved markedly in both industries.
Separating the Impact of Capacity Cuts from Aggregate Demand
In Chen, Ding, and Mano (2018) we find that a general recovery in aggregate demand, thanks to the government’s stimulus policies in 2015–2016, was likely a more important driver of China’s PPI reflation.
While capacity reduction has certainly played a role in propping up producer prices in steel and coal, it does not explain the broad-based reflation that touched other upstream industries whose production is not directly linked to steel or coal.
Eight upstream industries, including steel and coal, dominate the dynamics of China’s PPI. We first investigate the impact of capacity cuts in a panel setting by comparing price movements of the targeted industries (steel and coal) to those of the other six upstream industries while controlling for demand from downstream industries, which could drive price movements. To properly capture demand and yet remain parsimonious, we exploit a large number of variables that represent downstream demand and extract common demand factors. The top three common factors together explain around 70 percent of the variations of a set of 40 demand variables. They capture well the strengthening of demand after mid-2015, as the government implemented stimulus measures, which included boosting infrastructure spending, credit expansion, and housing market policies in response to the earlier growth slowdown. The strong pickup in housing market activity, for instance, had a direct impact on the demand for construction materials including steel.
Having estimated factors that capture demand conditions, we run a panel regression of the drivers of PPI, where we evaluate whether capacity cuts in steel and coal, measured as the actual capacity reduction relative to 2015 year-end capacity, had a statistically significant impact on producer prices. Capacity reduction efforts were indeed important in propping up steel and coal prices, representing about 34 and 25 of the change in PPI in 2016–2017, while demand factors represent 63 and 59 percent respectively, with the regression residuals accounting for the rest. Importantly, the PPI reflation in other upstream industries not subject to capacity reduction is explained by common demand factors.
To complement the panel analysis, we also conducted a time series analysis to examine the drivers of coal and steel prices separately. The individual sector regressions attribute an important role to capacity reduction efforts in steel but not for coal. For the steel industry, we find that demand still explains a substantial fraction of steel price movements (58 percent), while capacity cuts account for 42 percent, larger than in the panel regression. However, for the coal industry, we find that demand factors account for the full shift in PPI inflation in the sector, with capacity reduction becoming insignificant.
Final Thoughts
The pickup in aggregate demand likely reflected policies implemented in 2015–2016 to boost infrastructure investment and housing sector activities. Destocking in the residential housing market, for instance, contributed to a resurgence in housing prices and sales particularly in China’s smaller cities since 2015, until the government significantly tightened housing market policies to contain the house price bubble. There was a large increase in public sector infrastructure investment in 2016. Finally, tax cuts also may have played a role in boosting demand in downstream industries that supported upstream prices, such as the tax cut on vehicle purchases and a reduction in business taxes. Thus, the full package of stimulus policies seems to have been important.
Rising steel and coal prices also pushed up costs of downstream industries, including electricity generation, real estate, and manufacturing, and could just be a transfer without net positive welfare impacts. In this regard, the strong pickup in aggregate demand was important to mitigate the impact of surging steel and coal prices on the downstream industries. Without it, this would have hurt industries that use coal and steel as inputs, and would have been a transfer of resources to those two industries. Fortunately, strong demand allowed downstream industries (and other upstream industries) to also raise their prices.
A fuller cost-benefit analysis is outside of the scope of this paper but would be desirable if the government decides to expand capacity cuts to other industries. Supporting prices is a necessary condition for capacity cuts to have an overall positive welfare impact. But it is not sufficient, as capacity cuts alone can be simply a transfer, both within the intervened industries (from targeted firms to unaffected ones) and between intervened and non-intervened industries, and thus may not generate aggregate efficiency gains.
This article is based on Chen, L., Ding, D. and R. C. Mano, “China’s Capacity Reduction Reform and Its Impact on Producer Prices,” IMF Working Paper No. 18/216. The views expressed in IMF Working Papers are those of the authors and do not necessarily represent the views of the IMF, its Executive Board, or IMF management.
(Linxi Chen was a PhD student at Duke University at the time the working paper was written. Ding Ding and Rui Mano are economists at the International Monetary Fund.)
BP, 2017. Statistical Review of World Energy 2017. British Petroleum, London.
https://www.bp.com/en/global/corporate/energy-economics/statistical-review-of-world-energy/downloads.html
Chen, L, Ding, D. and R. C. Mano, “China’s Capacity Reduction Reform and Its Impact on Producer Prices,” IMF Working Paper No. 18/216.
https://www.imf.org/en/Publications/WP/Issues/2018/09/28/Chinas-Capacity-Reduction-Reform-and-Its-Impact-on-Producer-Prices-46223
EIU, 2017. China’s Supply-Side Structural Reforms: Progress and Outlook. Intelligence Unit, the Economist.
https://www.eiu.com/public/topical_report.aspx?campaignid=ChinaSSSR2017

Latest
Most Popular
- VoxChina Covid-19 Forum (Second Edition): China’s Post-Lockdown Economic Recovery VoxChina, Apr 18, 2020
- China’s Great Housing Boom Kaiji Chen, Yi Wen, Oct 11, 2017
- China’s Joint Venture Policy and the International Transfer of Technology Kun Jiang, Wolfgang Keller, Larry D. Qiu, William Ridley, Feb 06, 2019
- The Dark Side of the Chinese Fiscal Stimulus: Evidence from Local Government Debt Yi Huang, Marco Pagano, Ugo Panizza, Jun 28, 2017
- Wealth Redistribution in the Chinese Stock Market: the Role of Bubbles and Crashes Li An, Jiangze Bian, Dong Lou, Donghui Shi, Jul 01, 2020
- Evaluating Risk across Chinese Housing Markets Yongheng Deng, Joseph Gyourko, Jing Wu, Aug 02, 2017
- What Is Special about China’s Housing Boom? Edward L. Glaeser, Wei Huang, Yueran Ma, Andrei Shleifer, Jun 20, 2017
- Privatization and Productivity in China Yuyu Chen, Mitsuru Igami, Masayuki Sawada, Mo Xiao, Jan 31, 2018
- Daily Price Limits and the Magnet Effect Ting Chen, Zhenyu Gao, Jibao He, Wenxi Jiang, Wei Xiong, Oct 25, 2017
- How did China Move Up the Global Value Chains? Hiau Looi Kee, Heiwai Tang, Aug 30, 2017


