A Bridge on Economic Issues between China and the World


 Facebook
  Twitter
  Instagram
 WeChat
  Email
Email The Growth and Geography of RMB Trading

The 2019 Bank for International Settlements Triennial Foreign Exchange Survey reveals two different trends in RMB trading in 2016–2019 compared to the previous three year interval—a slowdown both in growth and in geographic diffusion. Regarding the first trend, we argue the rapid growth of RMB trading into 2014 relied on a gradual appreciation trend that encouraged a one-sided RMB internationalization. Global trading in RMB resumed its growth in 2017 with a healthier sense of two-way risk that would allow borrowing as well as investing in RMB. Regarding the second trend, we argue that Hong Kong’s gain in the share of RMB trading in 2016—2019 resulted from the way that China recently opened its domestic bond market. This tilted the playing field in favor of Hong Kong. This advantage may disappear with China’s further opening-up, and the market-driven geographic diffusion could re-emerge.
The Bank for International Settlements’ 2019 installment of its Triennial Central Bank Survey of Foreign Exchange Turnover in April 2019 (BIS, 2019) and its just-published analytic piece (Schrimpf and Sushko, 2019) highlight two changes in the international use of the renminbi (RMB) since the last triennial survey in 2016. The first change received most of the attention, but the second was more surprising.
The first change was a deceleration of the global growth in RMB trading during 2016—2019. In the three years prior to the 2016 survey, the RMB had doubled its share of global turnover in foreign exchange (FX) to 4%, and had overtaken the Mexican peso to become the most-traded emerging market (EM) currency (BIS, 2016). In the latest three-year interval, “turnover in the renminbi, however, grew only slightly faster than the aggregate [FX] market, and the renminbi did not climb further in the global rankings” (BIS, 2019). Meanwhile, turnover in EM currencies continued to increase, reaching 25% of global turnover. We argue that the deceleration in the growth of RMB turnover was not surprising and indeed was basically healthy from the standpoint of the balanced use of the renminbi by those outside China.
The second change was a shift in the geographical diffusion of the RMB’s offshore trading. Between 2013 and 2016, trading in the top two FX trading centers, London and New York, gained shares at the expense of the two Asian centers, Hong Kong SAR (henceforth Hong Kong) and Singapore. Cheung et al. (2019) hypothesized that, as EM currencies became more internationally used, their trading geography would converge to that of the FX market in general. However, in April 2019, while Singapore continued to lose market share, Hong Kong’s share of offshore RMB trading rose. We hypothesize that this reflects a transitory effect of features of China’s opening of its bond market, which has favored Hong Kong anew. Over time, we would expect the hypothesized convergence process to re-assert itself.
The deceleration in the growth of RMB trading
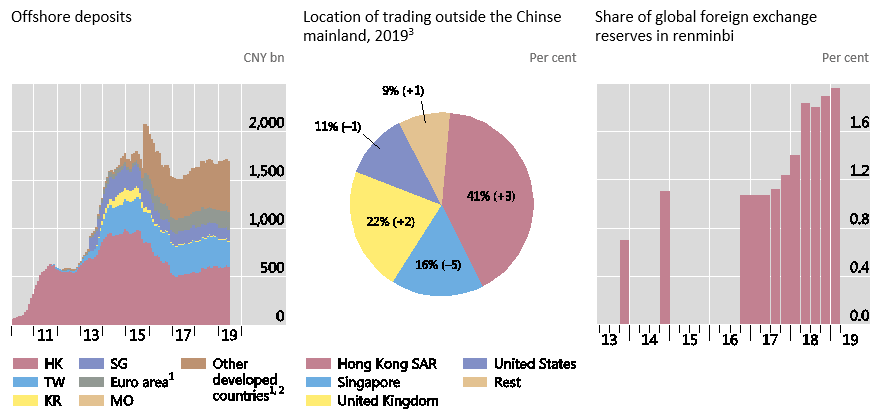
To understand the deceleration in the growth of RMB trading, it is important to appreciate how unusual its attraction was in the years leading into 2014. The RMB offered a nice pick-up over US dollar yields and an appreciating trend against the dollar as well. Professional investors engaged in lucrative and leveraged RMB-forward FX trades. The Sharpe ratio for this trade was about 2 in 2013–2014, which indicated that the RMB’s yield pick-up could be enjoyed with scant downside volatility. Indeed, the attraction of this trade led households and firms in neighboring economies and eventually around the world to build up RMB deposits (Graph 1, left-hand panel). This price incentive to hold the RMB coincided with China’s policies in the early 2010s to promote international use of the RMB. The RMB was internationalizing in a hot house, and rapid growth reflected the artificial environment.
The incentives to hold RMB changed after the RMB peaked against the dollar in early 2014. As the RMB declined against a generally strengthening dollar, offshore holdings of RMB also peaked and then declined. The Sharpe ratio declined to less than one; professional investors abandoned leveraged RMB positions. RMB trading in London, captured by half yearly reports by the London Foreign Exchange Joint Standing Committee, peaked in 2015, well before the April 2016 Triennial Survey. Thus, the rapid growth of RMB trading from April 2013 to April 2016 had already gone into reverse by the last quarters of that period. London RMB turnover then troughed in April 2017 and resumed its growth, more than doubling by April 2019 when central banks conducted the latest BIS triennial survey. Offshore RMB deposits troughed at about the same time but have not recovered so smartly.
Graph 1: Offshore RMB deposits, trading by location and share in official reserves
1. Data are available from Q2 2012 (as a part of CGFS enhancements) and the coverage is partial.
2. Australia, Canada, Denmark, Japan, Norway, Sweden, Switzerland, the United Kingdom and the United States.
3. As a total of CNY trading excluding the Chinese mainland.Sources: Packer et al. (2019), based on People’s Bank of China; CEIC; BIS locational banking statistics by residence and Triennial Central Bank Survey.
In short, the RMB’s growth as an international currency into 2014 benefitted from the warm and wet conditions of a green house. Everyone in the world wanted to hold the currency; no one wanted to borrow it. This was a one-sided and ultimately unsustainable form of currency internationalization. There was bound to be give-back when the currency came out of the greenhouse and faced normal weather. Looking forward to the 2022 Triennial, we expect the RMB’s share to increase as global portfolio managers allocate more to Chinese stocks and bonds and dynamically hedge the RMB risk.
The diffusion of offshore trading of the RMB
Cheung et al. (2019) drew attention to the striking similarity of the locations of global trading of the dollar and the yen. Apart from disproportionate trading in New York for the dollar and in Tokyo for the yen, their distributions resembled each other remarkably. Despite many differences in the dollar’s and yen’s global roles, their distribution of trading across London, Singapore, and Hong Kong differed little (Graph 2).
Graph 2: Turnover by center for the dollar and yen, 2016
Source: Bank for International Settlements (2016).
Notes: GB is Great Britain; US, United States: SG, Singapore: HK, Hong Kong SAR; JP, Japan; CN, the Chinese mainland.
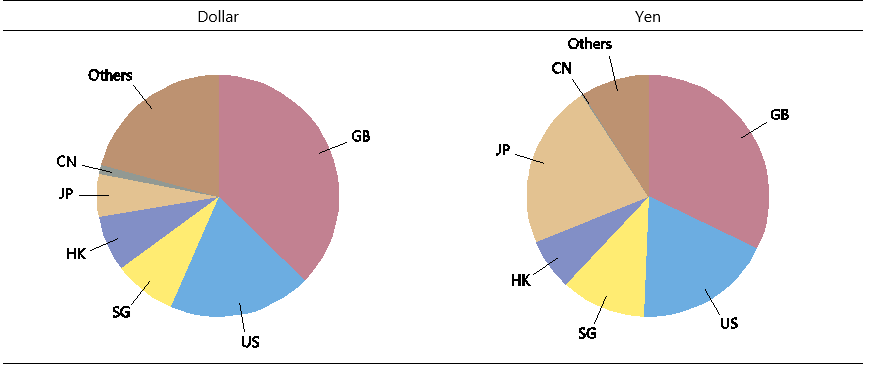
This suggested the hypothesis that the geography of trading of a currency undergoing internationalization would start off with a regional bias but over time come to resemble the global distribution of FX trading, or one could say, come to resemble the geography of trading of the dollar, since the dollar is on one side of almost 90% of all FX trades. If global investors hold RMB in their core portfolios, then they need to trade it where they trade all the other currencies.
To test this hypothesis, we examined offshore trades in the RMB by location. The BIS triennial survey data for 2013 and 2016 lined up with the theory. We found that the Asian centers, which were favored by the initial policies allowing offshore RMB use, had lost shares to other centers much farther away from Shanghai, especially London and New York (Graph 3). In particular, trading in London and New York reached a quarter of the total from its 22% level three years earlier. It looked like the diffusion process showed the progressive impact of market forces on initial conditions that bore the imprint of policy.
Graph 3: Turnover of the renminbi by location, 2013 and 2016
Source: Bank for International Settlements (2016).
Note: GB is Great Britain; US, United States: SG, Singapore: HK, Hong Kong SAR; JP, Japan; CN, the Chinese mainland.
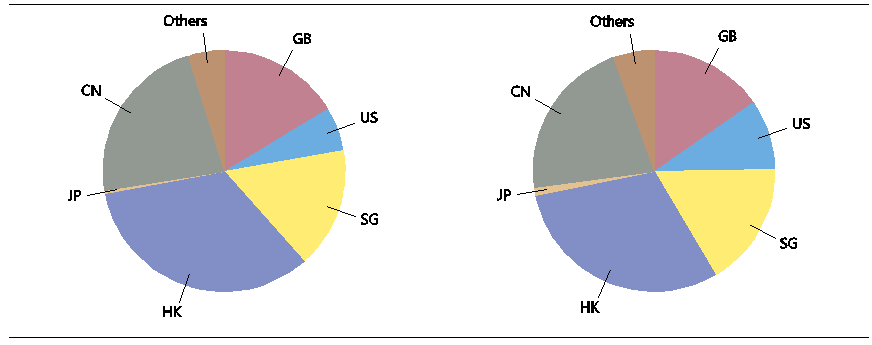
The analysis is based on estimation of an error correction model with RMB trading distribution data in 2013 and 2016: the difference between a center’s share of all FX trading and RMB trading would significantly affect a center’s change in RMB share. We estimated such a model and found a significant and negative relation: centers with more than their share of RMB trading—judged by the standard of the overall distribution of FX trading—lost share in RMB trading in 2016. Those with less than their share, gained share in RMB trading.
What is more, we estimated this model for other emerging currencies for which the BIS survey had reasonably comprehensive data. We found that similar results dominated the significant estimates (Graph 4). In particular, the geography of trading the Hong Kong dollar, the Indian rupee, the Mexican peso, and the Korean won all showed convergence to the global distribution of FX trading.
Graph 4: Renminbi diffusing most quickly
Coefficient on gap between center’s share trading of respective currency and its share of all currencies X -1
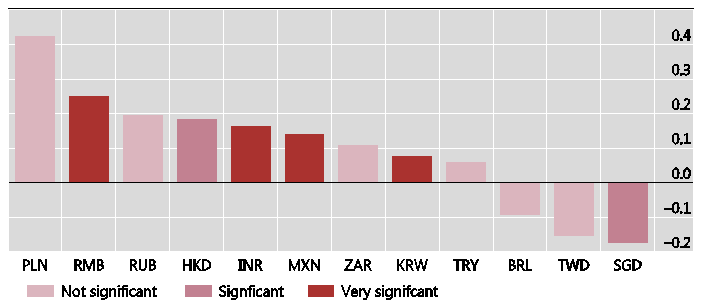
Source: Cheung et al. (2019), Table 3, negative of gap coefficient in first column.
How do the 2019 data look? In Graph 1, center panel, the distribution of offshore trading of the RMB in April 2019 does not resoundingly confirm our theory. It is consistent with our theory that London gained share from the Asian centers in aggregate, yet early mover Hong Kong’s gain in share is not consistent.
Our interpretation is that the opening of China’s bond market, inter alia through Bond Connect, has initially favored Hong Kong. As the opening-up continues, Hong Kong should lose its inside (policy) track and RMB trading should revert to the (market-driven) diffusion more evident in the change between the 2013 and 2016 Triennial Surveys.
A more open RMB bond market requires not only spot RMB purchases to buy the bonds but also involves even more FX trading to hedge them. Most managers of global bond portfolios dynamically hedge currency risk (more so than equity managers [Borio et al., 2017)]. With various liberalization measures, foreign holdings of Chinese government and other bonds doubled in the three years prior to March 2019 to $430 billion (see Note 1). The sharp rise in bond holdings from Bond Connect’s inception in mid-2017 matches the rapid rise in RMB turnover reported by Hong Kong’s Treasury Market Association (see Note 2). Moreover, China’s domestic FX market shows the increasing importance of FX swap transactions, which, unlike spot trades, are used to hedge (see Note 3). With the opening of this market to investors outside of China, onshore RMB trades with counterparties outside the Mainland reached 3% of all RMB trades in April 2019, or almost $9 billion per day, up from practically none in April 2016 [Packer et al. (2019)]. If this cross-border trading takes place largely with counterparties in Hong Kong, they help account for Hong Kong’s gain in RMB trading share (see Note 4).
Conclusions
To assess the RMB’s progress as an international currency, one needs to examine both quantity and geography. The slowdown in the growth of RMB trading after the April 2016 Triennial Survey should not have surprised anyone. Already visible in London trading before then, it reflected the end of the RMB’s gradual appreciation against the dollar in early 2014. In effect, the RMB had grown rapidly in a hothouse and its growth slowed down after it encountered more normal weather conditions.
As an aspiring international currency, the RMB presents a live case of how trading of an international currency can spread. The RMB’s trading geography has continued to diffuse from Asia to London and other centers, though this process clearly slowed way down in the last three years. We hypothesize that RMB trading in Hong Kong has benefitted particularly from the way that the authorities have opened the Chinese domestic bond market. Over time, as the channels for investing in Chinese bonds and for making related FX hedging trades with banks in China multiply, this benefit may wane. In this case, RMB trading may again more clearly diffuse to the global pattern of FX trading.
Note 1: China’s State Administration of Foreign Exchange, The time-series data of International Investment Position of China, http://www.safe.gov.cn/en/2018/0928/1459.html.
Note 2: It reported $67.7 billion in RMB trading in April 2017, $74.9 in October 2017, $87 billion in April 2018, $91 billion in October 2018 and $105.6 in 2019. See www.tma.org.hk/NewsPhoto/results%20of%20the%20semi-annual%20fx%20survey%20(oct%202017)%20-%20annex.pdf.
Note 3: China’s State Administration of Foreign Exchange data show that the trading of swaps in the onshore market was 52% of domestic RMB turnover in April 2016, but 62% of RMB turnover in April 2019.
Note 4: It is not clear how the liberalization measures privilege Hong Kong. While Bond Connect trades need to be done out of a Hong Kong account, it is not obvious why that leads to FX trades with Hong Kong sales desks, which is the basis for the BIS survey’s geographical assignment.
(Yin-Wong Cheung, Hung Hing Ying Chair Professor of International Economics, Department of Economics and Finance, City University of Hong Kong; Robert N. McCauley, Corte Real Advisors; Chang Shu, Bloomberg Economics.)
References
Bank for International Settlements (2016, 2019). Triennial Central Bank Survey: Foreign Exchange Turnover in April 2016, 2019, September. https://www.bis.org/statistics/rpfx19_fx.pdf and https://www.bis.org/publ/rpfx16fx.pdf.
Borio, C, R McCauley and P McGuire (2017). ”FX swaps and forwards: missing global debt?,” BIS Quarterly Review, September 2017, pp 37–54. https://www.bis.org/publ/qtrpdf/r_qt1709e.htm.
Cheung, Y-W, R McCauley and C Shu (2019). “Geographic spread of currency trading: the renminbi and other EM currencies,” China & World Economy, vol 27, no 4, September, pp 25–36, https://onlinelibrary.wiley.com/doi/10.1111/cwe.12292; also available as BIS Working Paper no 806, August 2019, https://www.bis.org/publ/work806.htm.
Packer, F, A Schrimpf and V Sushko (2019). “Renminbi turnover tilts onshore,” BIS Quarterly Review, December, pp 35–36.
Schrimpf, A and V Sushko (2019). “Sizing up global foreign exchange markets,” BIS Quarterly Review, December, pp 21–38. https://www.bis.org/publ/qtrpdf/r_qt1912f.htm.

Latest
Most Popular
- VoxChina Covid-19 Forum (Second Edition): China’s Post-Lockdown Economic Recovery VoxChina, Apr 18, 2020
- China’s Great Housing Boom Kaiji Chen, Yi Wen, Oct 11, 2017
- China’s Joint Venture Policy and the International Transfer of Technology Kun Jiang, Wolfgang Keller, Larry D. Qiu, William Ridley, Feb 06, 2019
- The Dark Side of the Chinese Fiscal Stimulus: Evidence from Local Government Debt Yi Huang, Marco Pagano, Ugo Panizza, Jun 28, 2017
- Wealth Redistribution in the Chinese Stock Market: the Role of Bubbles and Crashes Li An, Jiangze Bian, Dong Lou, Donghui Shi, Jul 01, 2020
- Evaluating Risk across Chinese Housing Markets Yongheng Deng, Joseph Gyourko, Jing Wu, Aug 02, 2017
- What Is Special about China’s Housing Boom? Edward L. Glaeser, Wei Huang, Yueran Ma, Andrei Shleifer, Jun 20, 2017
- Privatization and Productivity in China Yuyu Chen, Mitsuru Igami, Masayuki Sawada, Mo Xiao, Jan 31, 2018
- Daily Price Limits and the Magnet Effect Ting Chen, Zhenyu Gao, Jibao He, Wenxi Jiang, Wei Xiong, Oct 25, 2017
- How did China Move Up the Global Value Chains? Hiau Looi Kee, Heiwai Tang, Aug 30, 2017


