A Bridge on Economic Issues between China and the World


 Facebook
  Twitter
  Instagram
 WeChat
  Email
Email Bright Side of Government Credit: Evidence from a Superbank in China

This study traces the heterogeneous effects of government credit across different levels of the supply chain. I find that China Development Bank's industrial loans to state-owned enterprises crowd out private firms in the same industry but crowd in private firms in downstream industries. Moreover, China Development Bank's infrastructure loans crowd in private firms. It is important for policy makers to disentangle these opposing effects of government credit.
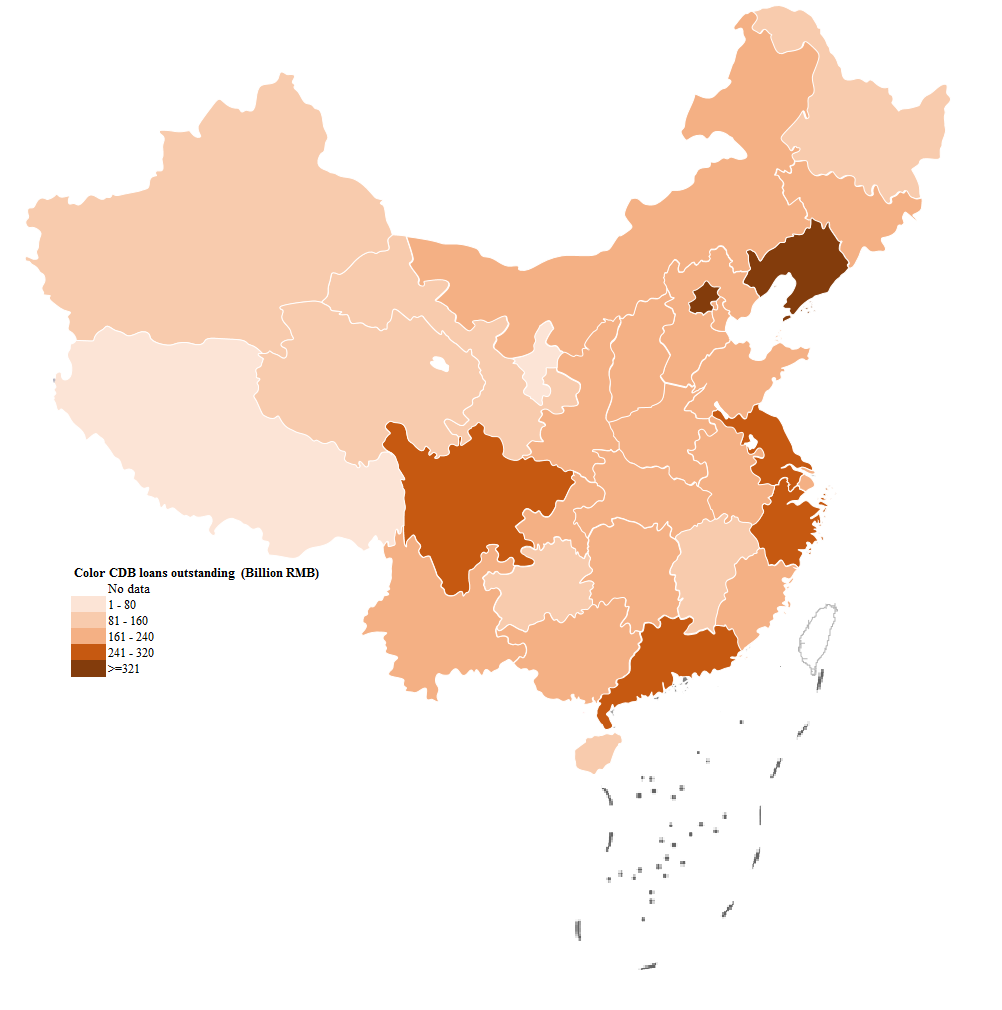
China began its economic reforms in 1978 under Deng Xiaoping; these reforms have fueled China’s rapid economic growth for decades. Concurrently, China has developed the biggest banking market in the world, with a total size of 19.6 trillion USD in 2018 (See Note 1). The Chinese government plays a critical role in the banking industry. For example, the China Development Bank (CDB), the world’s largest development finance institution, is a fully state-owned bank with 14.34 trillion RMB in total assets. The CDB (See Note 2) has a mandate to grant subsidized credit to local governments for infrastructure development and to state-owned enterprises (SOEs) in strategic industries (e.g., energy and mining). As shown in Figure 1, total outstanding domestic loans increased dramatically from 77 billion RMB in 1994 to 5.8 trillion RMB in 2013. On average, more than half of these loans have been for infrastructure development. For example, in 2013, 59.3% of the outstanding loans were for infrastructure, and 40.7% were for industrial firms. Among industrial loans, Figure 2 shows that in 2008, approximately 35% of CDB loans were issued to firms in the electric power industry (152.7 billion RMB). The second-largest industry in 2008 was petroleum, with a loan issuance of 83.3 billion RMB, and the third-largest industry was non-ferrous metal mining, which are mostly strategic industries at the top of the supply chain. Thus, the CDB can be viewed as an extension of the government’s fiscal function for policy-related areas across the country (Figure A1 in Appendix shows the CDB loan distribution across provinces in China.).
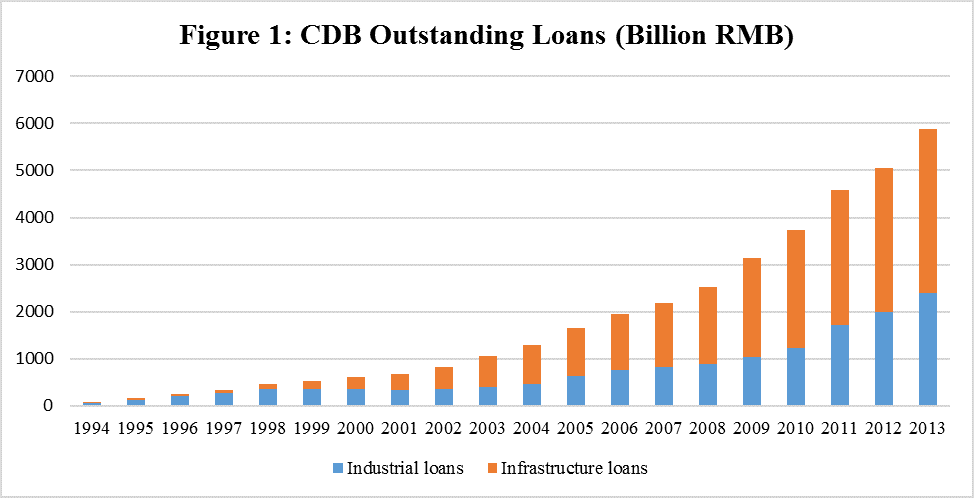
Figure 1: This figure shows the increase in the CDB’s outstanding industrial and infrastructure loans between 1994 and 2013. Based on CDB industry codes, I classify the infrastructure loans in the following industries: storage, public facilities, health, geological exploration, water management, water production and supply, gas production and supply, environmental management, telecommunications, public transportation, education, air transport, pipeline transportation, road transportation, postal, railroad transport, and other transport services. CDB loans to all other industries are classified as industrial loans. The unit is billions of RMB.
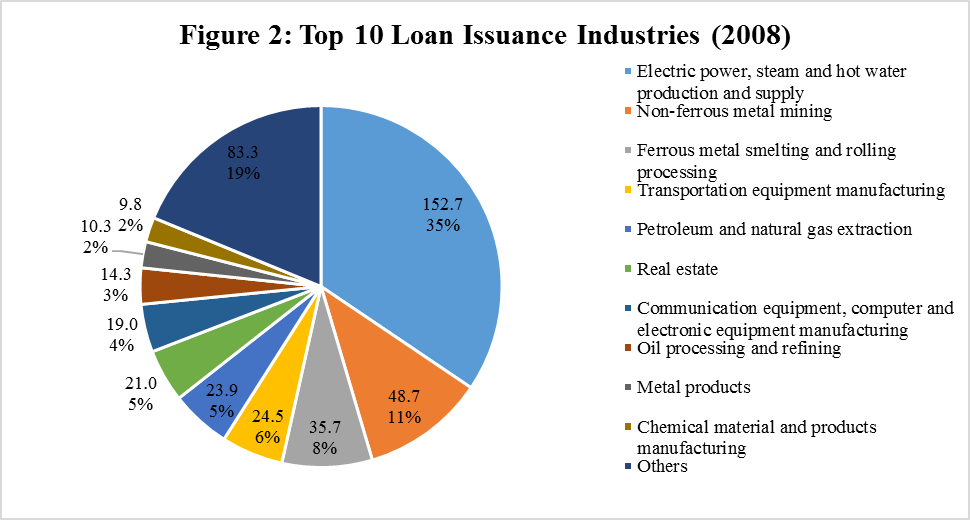
Figure 2: This figure shows the top ten industries for the issuance of new CDB loans in 2008. I compute the total issuance of CDB loans in each industry (excluding infrastructure industries) and report the largest 10 industries. All the remaining industries are shown in "Others." I report both the percentages of issuances and the amounts of issuance. The unit is billions of RMB.
Academic scholars and policy-makers have long debated whether government credit is good or bad for economic development and efficiency. In Ru (2018), I find that between 1998 and 2009, a $1 increase in outstanding CDB loan amounts to SOEs led to a $0.33 decrease in total assets of private firms in the same industry. This is consistent with the conventional wisdom that SOEs distort credit allocation, which crowds out productive private firms and leads to economic slowdown in China (e.g., Huang, Pagano, and Panizza, (2017); Song and Xiong (2017)). Moreover, although CDB credit to SOEs crowds out private firms in the same industry, it crowds in private firms in downstream industries. In particular, a $1 increase in the CDB’s outstanding SOE loan amounts led to a $1.08 increase in total assets of private firms in downstream industries. This suggests that subsidized CDB policy loans to SOEs in upstream industries (e.g., energy) have positive externality on productive private firms in downstream industries (e.g., manufacturing). Furthermore, I find that CDB loans to infrastructure developments have crowding-in effects. In particular, a $1 increase in CDB infrastructure loan amounts leads to a $0.47 increase in private firms' assets. In short, CDB industrial loans to SOEs crowd out private firms in the same industry but crowd in private firms in downstream industries, while CDB infrastructure loans generally have crowding-in effects (See Note 3).
Additionally, the overall crowding-in effects of CDB loans on downstream industry were larger in earlier years and have been decreasing over time. One of the potential reasons is that the CDB lends mainly to policy-related areas that shift over time from industries at the top of the supply chain to downstream industries. For example, Figure 3 shows that in 2013, real estate became the CDB’s largest industry, with a loan issuance of 229.9 billion RMB. Moreover, compared with 2008 in Figure 2, the CDB’s lending in the manufacturing industries increased considerably in 2013 (e.g., special equipment manufacturing, electronic equipment manufacturing). The shift from upstream to downstream could lead to stronger crowding-out effects in the same industries and weaker crowding-in effects in downstream industries.
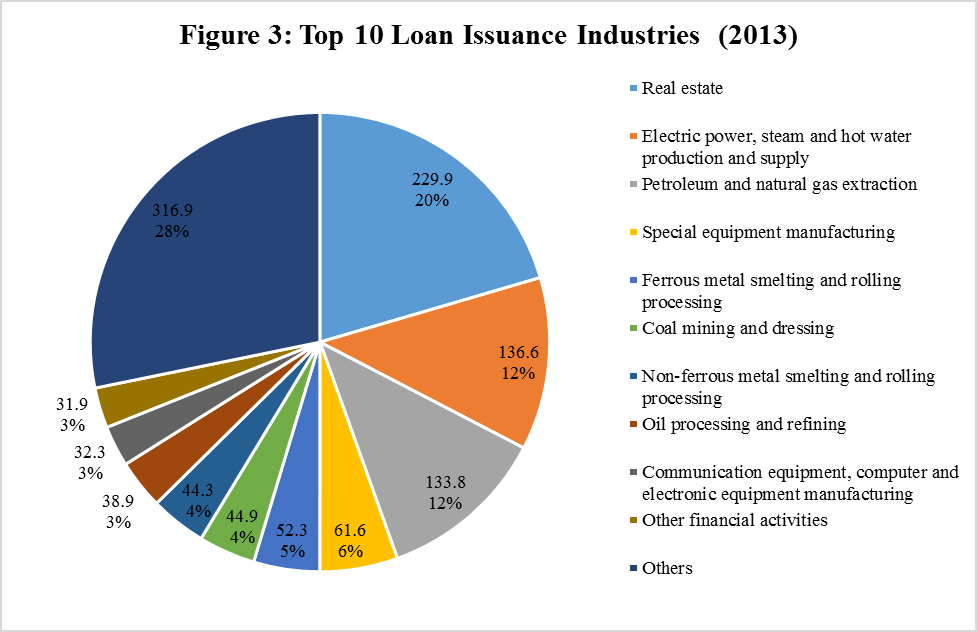
Figure 3: This figure shows the top ten industries for new loan issuance by the CDB in 2013. I compute the total issuance of CDB loans in each industry (excluding infrastructure industries) and report the largest 10 industries. All the remaining industries are shown in "Others." I report both the percentages of issuances and amounts of issuance. The unit is billions of RMB.
The countervailing effects of CDB loans serve to emphasize the importance of understanding the heterogeneous effects of government credit across different levels of the supply chain and across different types of investment. It is essential for policy makers to assess both the benefits and costs of government credit, especially for potential positive externalities. China, after decades of rapid development, is the second-largest economy in the world, and is equipped with world-class infrastructure (e.g., the bullet train, the national trunk highway), which is reshaping the economy mostly in positive ways. The CDB plays a critical role in this process by supporting infrastructure development and strategic industries at the top of the supply chain. With all the critiques on China’s economy (e.g., distorted incentives of SOEs, frictions in the financial market, inefficient resource allocation), one fact beyond dispute is that China has been the world’s most successful country in terms of economic growth during the past several decades. While it is important to study the dark side of China’s economy (e.g., looming default risks of the debt market), it is equally important to learn from the bright side of China’s success.
Note 1: In February 2018, the total amount of bank loans in China reached 19.6 trillion USD, which ranks number one across the globe. The United States ranks second, with 9.1 trillion USD, and Japan is third with 5.5 trillion USD. The data are from https://www.ceicdata.com/en
Note 2: The CDB is fully state-owned, with the Ministry of Finance and the China Investment Corporation as its two main shareholders. In contrast to commercial banks in China, the CDB, as the policy bank, does not seek to maximize profit. On average, the CDB's long-term loan rates have remained lower (approximately 100 bps) than those of state-owned commercial banks— and much lower than private or shareholding commercial banks. Moreover, Gao, Ru, and Tang (2017) find that the CDB has a much lower default rate than commercial banks in lending to local governments.
Note 3: The proprietary CDB data in Ru (2015) was obtained directly from the CDB. It contains both city- and province-level loan data. At the province level, the CDB data record monthly aggregate outstanding loan amounts and loan issuances in 95 industries for each of the 31 provinces in mainland China from 1998 to 2013. The industries include infrastructure sectors (such as roads, air, rail transportation, water supply, and public facilities) and industry sectors (such as agriculture, tobacco, software, oil refining, and textiles). At the city level, the data record annual aggregate CDB outstanding loan amounts and loan issuances to both infrastructure projects and industrial firms from 1998 to 2010 across 310 cities in China.
Gao, Haoyu, Hong Ru, and Dragon Yongjun Tang, 2017, Subnational Debt of China: The Politics-finance Nexus. Working Paper.
Huang, Yi, Marco Pagano, and Ugo Panizza, 2017, Local Crowding Out in China. Working paper, The Graduate Institute Geneva and The University of Naples Federico II.
Ru, Hong, 2018, Government Credit, a Double-Edged Sword: Evidence from the China Development Bank. The Journal of Finance, 73.1, 275-316.
Song, Z. and Xiong, W., 2017. Risks in China’s Financial System. Working Paper.
Appendix
China began its economic reforms in 1978 under Deng Xiaoping; these reforms have fueled China’s rapid economic growth for decades. Concurrently, China has developed the biggest banking market in the world, with a total size of 19.6 trillion USD in 2018 (See Note 1). The Chinese government plays a critical role in the banking industry. For example, the China Development Bank (CDB), the world’s largest development finance institution, is a fully state-owned bank with 14.34 trillion RMB in total assets. The CDB (See Note 2) has a mandate to grant subsidized credit to local governments for infrastructure development and to state-owned enterprises (SOEs) in strategic industries (e.g., energy and mining). As shown in Figure 1, total outstanding domestic loans increased dramatically from 77 billion RMB in 1994 to 5.8 trillion RMB in 2013. On average, more than half of these loans have been for infrastructure development. For example, in 2013, 59.3% of the outstanding loans were for infrastructure, and 40.7% were for industrial firms. Among industrial loans, Figure 2 shows that in 2008, approximately 35% of CDB loans were issued to firms in the electric power industry (152.7 billion RMB). The second-largest industry in 2008 was petroleum, with a loan issuance of 83.3 billion RMB, and the third-largest industry was non-ferrous metal mining, which are mostly strategic industries at the top of the supply chain. Thus, the CDB can be viewed as an extension of the government’s fiscal function for policy-related areas across the country (Figure A1 in Appendix shows the CDB loan distribution across provinces in China.).
Figure 1: This figure shows the increase in the CDB’s outstanding industrial and infrastructure loans between 1994 and 2013. Based on CDB industry codes, I classify the infrastructure loans in the following industries: storage, public facilities, health, geological exploration, water management, water production and supply, gas production and supply, environmental management, telecommunications, public transportation, education, air transport, pipeline transportation, road transportation, postal, railroad transport, and other transport services. CDB loans to all other industries are classified as industrial loans. The unit is billions of RMB.
Academic scholars and policy-makers have long debated whether government credit is good or bad for economic development and efficiency. In Ru (2018), I find that between 1998 and 2009, a $1 increase in outstanding CDB loan amounts to SOEs led to a $0.33 decrease in total assets of private firms in the same industry. This is consistent with the conventional wisdom that SOEs distort credit allocation, which crowds out productive private firms and leads to economic slowdown in China (e.g., Huang, Pagano, and Panizza, (2017); Song and Xiong (2017)). Moreover, although CDB credit to SOEs crowds out private firms in the same industry, it crowds in private firms in downstream industries. In particular, a $1 increase in the CDB’s outstanding SOE loan amounts led to a $1.08 increase in total assets of private firms in downstream industries. This suggests that subsidized CDB policy loans to SOEs in upstream industries (e.g., energy) have positive externality on productive private firms in downstream industries (e.g., manufacturing). Furthermore, I find that CDB loans to infrastructure developments have crowding-in effects. In particular, a $1 increase in CDB infrastructure loan amounts leads to a $0.47 increase in private firms' assets. In short, CDB industrial loans to SOEs crowd out private firms in the same industry but crowd in private firms in downstream industries, while CDB infrastructure loans generally have crowding-in effects (See Note 3).
Additionally, the overall crowding-in effects of CDB loans on downstream industry were larger in earlier years and have been decreasing over time. One of the potential reasons is that the CDB lends mainly to policy-related areas that shift over time from industries at the top of the supply chain to downstream industries. For example, Figure 3 shows that in 2013, real estate became the CDB’s largest industry, with a loan issuance of 229.9 billion RMB. Moreover, compared with 2008 in Figure 2, the CDB’s lending in the manufacturing industries increased considerably in 2013 (e.g., special equipment manufacturing, electronic equipment manufacturing). The shift from upstream to downstream could lead to stronger crowding-out effects in the same industries and weaker crowding-in effects in downstream industries.
The countervailing effects of CDB loans serve to emphasize the importance of understanding the heterogeneous effects of government credit across different levels of the supply chain and across different types of investment. It is essential for policy makers to assess both the benefits and costs of government credit, especially for potential positive externalities. China, after decades of rapid development, is the second-largest economy in the world, and is equipped with world-class infrastructure (e.g., the bullet train, the national trunk highway), which is reshaping the economy mostly in positive ways. The CDB plays a critical role in this process by supporting infrastructure development and strategic industries at the top of the supply chain. With all the critiques on China’s economy (e.g., distorted incentives of SOEs, frictions in the financial market, inefficient resource allocation), one fact beyond dispute is that China has been the world’s most successful country in terms of economic growth during the past several decades. While it is important to study the dark side of China’s economy (e.g., looming default risks of the debt market), it is equally important to learn from the bright side of China’s success.
Note 1: In February 2018, the total amount of bank loans in China reached 19.6 trillion USD, which ranks number one across the globe. The United States ranks second, with 9.1 trillion USD, and Japan is third with 5.5 trillion USD. The data are from https://www.ceicdata.com/en
Note 2: The CDB is fully state-owned, with the Ministry of Finance and the China Investment Corporation as its two main shareholders. In contrast to commercial banks in China, the CDB, as the policy bank, does not seek to maximize profit. On average, the CDB's long-term loan rates have remained lower (approximately 100 bps) than those of state-owned commercial banks— and much lower than private or shareholding commercial banks. Moreover, Gao, Ru, and Tang (2017) find that the CDB has a much lower default rate than commercial banks in lending to local governments.
Note 3: The proprietary CDB data in Ru (2015) was obtained directly from the CDB. It contains both city- and province-level loan data. At the province level, the CDB data record monthly aggregate outstanding loan amounts and loan issuances in 95 industries for each of the 31 provinces in mainland China from 1998 to 2013. The industries include infrastructure sectors (such as roads, air, rail transportation, water supply, and public facilities) and industry sectors (such as agriculture, tobacco, software, oil refining, and textiles). At the city level, the data record annual aggregate CDB outstanding loan amounts and loan issuances to both infrastructure projects and industrial firms from 1998 to 2010 across 310 cities in China.
(Hong Ru, Nanyang Business School, Nanyang Technological University.)
Gao, Haoyu, Hong Ru, and Dragon Yongjun Tang, 2017, Subnational Debt of China: The Politics-finance Nexus. Working Paper.
Huang, Yi, Marco Pagano, and Ugo Panizza, 2017, Local Crowding Out in China. Working paper, The Graduate Institute Geneva and The University of Naples Federico II.
Ru, Hong, 2018, Government Credit, a Double-Edged Sword: Evidence from the China Development Bank. The Journal of Finance, 73.1, 275-316.
Song, Z. and Xiong, W., 2017. Risks in China’s Financial System. Working Paper.
Appendix
Figure A1: This figure shows the outstanding CDB loans for each province in 2013. I aggregate the outstanding loans for all industries (including infrastructure) for each province in 2013.

Latest
Most Popular
- VoxChina Covid-19 Forum (Second Edition): China’s Post-Lockdown Economic Recovery VoxChina, Apr 18, 2020
- China’s Great Housing Boom Kaiji Chen, Yi Wen, Oct 11, 2017
- China’s Joint Venture Policy and the International Transfer of Technology Kun Jiang, Wolfgang Keller, Larry D. Qiu, William Ridley, Feb 06, 2019
- The Dark Side of the Chinese Fiscal Stimulus: Evidence from Local Government Debt Yi Huang, Marco Pagano, Ugo Panizza, Jun 28, 2017
- Wealth Redistribution in the Chinese Stock Market: the Role of Bubbles and Crashes Li An, Jiangze Bian, Dong Lou, Donghui Shi, Jul 01, 2020
- Evaluating Risk across Chinese Housing Markets Yongheng Deng, Joseph Gyourko, Jing Wu, Aug 02, 2017
- What Is Special about China’s Housing Boom? Edward L. Glaeser, Wei Huang, Yueran Ma, Andrei Shleifer, Jun 20, 2017
- Privatization and Productivity in China Yuyu Chen, Mitsuru Igami, Masayuki Sawada, Mo Xiao, Jan 31, 2018
- Daily Price Limits and the Magnet Effect Ting Chen, Zhenyu Gao, Jibao He, Wenxi Jiang, Wei Xiong, Oct 25, 2017
- How did China Move Up the Global Value Chains? Hiau Looi Kee, Heiwai Tang, Aug 30, 2017


