A Bridge on Economic Issues between China and the World


 Facebook
  Twitter
  Instagram
 WeChat
  Email
Email Industrial Policy and Retaliatory Protection under the WTO:Lessons from China
Industrial policy is increasingly implemented worldwide, with many policymakers and researchers highlighting its benefits (Juhász et al. 2024). However, the cost of industrial policy remains less understood. Using Chinese firm-level data, we show that higher industrial subsidies raise the likelihood and severity of foreign anti-dumping and countervailing duties at each investigation stage (Feng et al. 2025). These retaliatory tariffs wipe out roughly a quarter of the firm revenue growth the subsidies would otherwise create. Neglecting this channel may lead governments to overstate the net benefits of industrial policy and fuels deeper trade frictions and geoeconomic fragmentation.

Over the past two decades, China has become the primary target of antidumping and countervailing (AD/CVD) investigations globally, accounting for roughly one-third of all cases, as Figure 1(b) illustrates. Both the frequency of investigations and the share resulting in duties have increased significantly. By 2020, around 15% of Chinese exports to the US were subject to AD/CVD tariffs.
Figure 1: Trends in Global AD/CVD Investigations and China’s Exposure
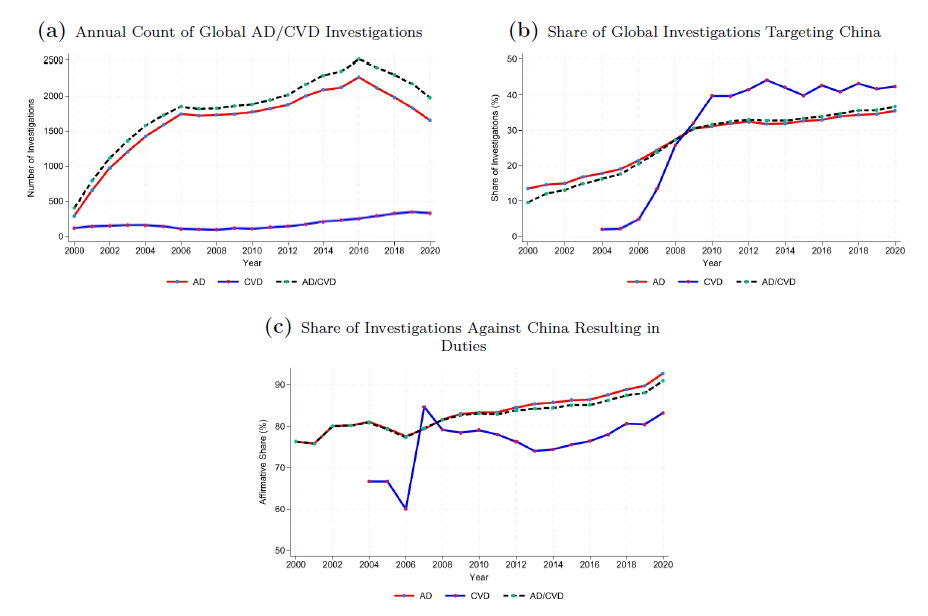
Notes: Figure 1 illustrates trends in global AD/CVD investigations from 2000 to 2020. Panel (a) reports the annual count of investigations worldwide. Panel (b) shows the share of these investigations that targeted China. Panel (c) presents the share of investigations against China that resulted in affirmative outcomes (i.e., the imposition of duties).
Source: Temporary Trade Barriers Database (Bown et al. 2025) and authors’ calculations.
Moreover, subsidized firms are disproportionately affected. Figure 2 shows that the distribution of tariffs for subsidized Chinese exporters is significantly right-shifted compared to nonsubsidized Chinese exporters, indicating consistently higher duties. This pattern is robust for both large and small firms.1
Figure 2: AD/CVD Duty Distribution for Subsidized and Nonsubsidized Chinese Exporters
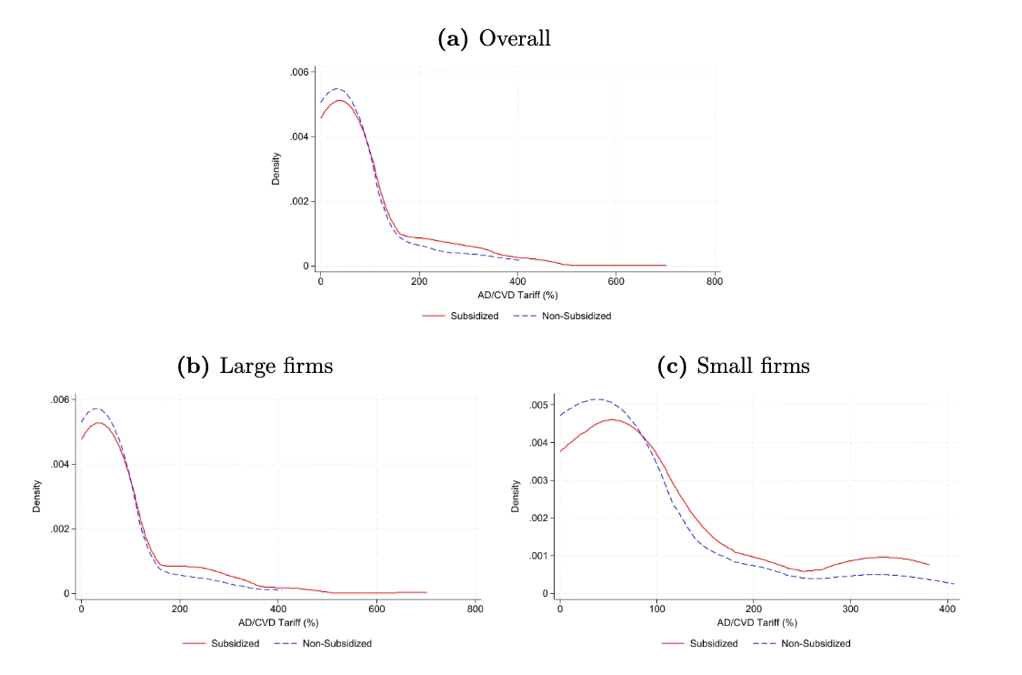
Notes: This figure compares the distribution of AD/CVD duty rates between subsidized and nonsubsidized Chinese exporters. Panel (a) presents the overall distribution, where the red solid line represents subsidized Chinese exporters and the blue dashed line represents nonsubsidized Chinese exporters. Panels (b) and (c) show the distributions separately for large Chinese exporters (above-median assets) and small Chinese exporters (below-median assets), respectively. Firm size is measured using the log of total assets.2
Motivated by these facts, this column examines the impact of Chinese subsidies on foreign AD/CVD investigations by combining comprehensive data on Chinese industrial firms with the global universe of AD/CVD cases against China. For firm business information, we use the Annual Survey of Industrial Firms (ASIF) for 2000–2008 and the Annual Tax Survey (STA) for 2009–2016. We match these datasets to the Chinese Customs Database at the firm-year level. We identify firms affected by AD/CVD investigations by linking their exported products to the products under investigation. We also identify firms that received lower, firm-specific duties—as opposed to product-wide duties—by matching them based on their names. Our analysis compares the AD/CVD investigation outcomes for firms resulting from the subsidies they received in the three years leading up to the investigations.
We find that higher industrial subsidies lead to more adverse AD/CVD measures at all stages of AD/CVD investigation. Specifically, heavily subsidized products are more likely to receive affirmative AD/CVD rulings, which lead to tariffs. Among affirmative investigations, industrial subsidies also lead to higher tariffs. At the firm level, firms receiving larger subsidies are less likely to be granted firm-specific duties, which are lower than product-level tariffs applied to other exporters of the investigated product. Among those that do receive firm-specific treatment, higher subsidies are associated with higher assigned duty rates.
Retaliatory tariffs offset approximately 25% of the subsidy’s positive impact on firm growth. Researchers estimating the effect of industrial policies should account for the associated increase in AD/CVD duties. Ignoring this subsidy cost creates a downward omitted variable bias because the resulting duties undermine firm growth.
AD/CVD duties become a significant subsidy cost for heavily subsidized firms or those seeking firm-specific rates
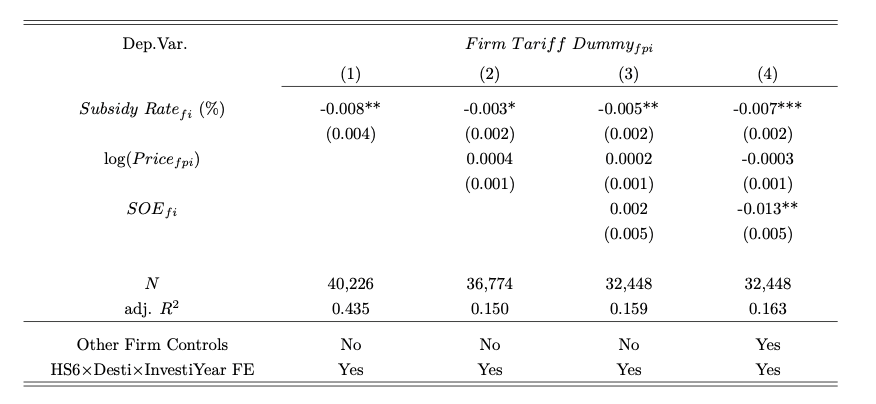
Table 1 shows that, a one percentage point (pp) increase in a firm’s subsidy rate leads to a 0.16 pp rise in the expected AD/CVD tariff for an average firm in the economy.3 Despite this moderate average effect, the highly skewed distribution of subsidy rates means firms in the right tail face significant trade cost. A firm increasing its subsidy rate from the 5th percentile (0%) to the 99th percentile (115%) expects to face an 18 pp increase in foreign AD/CVD tariffs.
Table 1: Effect of Subsidy on Expected AD/CVD Tariff Faced by an Average Firm
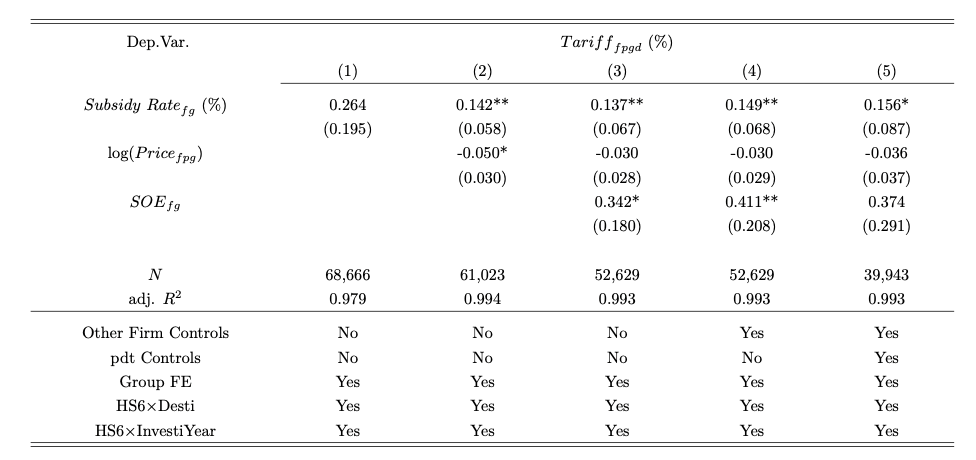
Notes: Robust standard errors clustered at the firm level are reported in parentheses below the coefficients. Asterisks denote significance levels∗ < 0.1, ∗∗ < 0.05, ∗∗∗ < 0.01.
Moreover, among firms that appeal for firm-specific tariffs, as their subsidy information undergoes scrutiny during the investigation, the tariff increase is substantially larger. Table 2 shows that a one percentage point increase in the subsidy rate leads to a 2 pp increase in the assigned AD/CVD tariff. At the same time, as reported in Table 3, the probability of receiving the firm-specific rate falls by 0.7 pp. Given that the average product-level tariff is 145% while the average firm-specific tariff is 81%, this translates into a 47 pp increase in the expected tariff faced by firms potentially eligible for firm-specific treatment.
Table 2: Subsidies Increase Firm-specific Tariffs
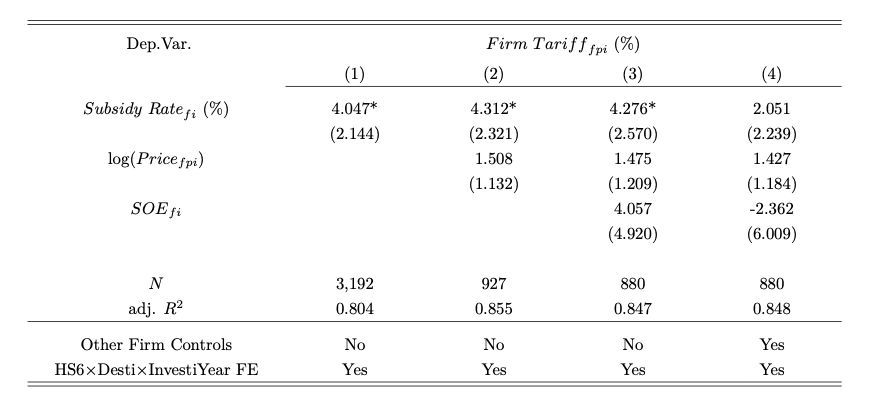
Notes: Robust standard errors clustered at the firm level are reported in parentheses below the coefficients. Asterisks denote significance levels∗ < 0.1, ∗∗ < 0.05, ∗∗∗ < 0.01.
Table 3: Subsidies Reduce Probability of Receiving Firm-specific Tariffs
Notes: Robust standard errors clustered at the firm level are reported in parentheses below the coefficients. Asterisks denote significance levels∗ < 0.1, ∗∗ < 0.05, ∗∗∗ < 0.01.
Tariffs significantly erode the benefits of subsidies
The intended benefits of industrial subsidies on firm revenue growth, employment, and productivity are partially offset by increased foreign trade protection. Using an instrumental variable strategy, we compare five-year revenue growth across firms with different subsidy levels, both with and without controlling for AD/CVD tariffs. Table 4 shows, when tariffs are omitted, a 1 pp increase in the subsidy rate leads to a 1.2% increase in revenue. When tariffs are included, the same subsidy yields a 1.5% gain. The 0.3 pp difference implies that retaliation offsets approximately 25% of the subsidy’s growth effect. Similar attenuation is observed in firm-level employment (17%) and productivity (30%).
Table 4: AD/CVD Tariffs Undermine the Subsidy Effect on Firm Revenue Growth
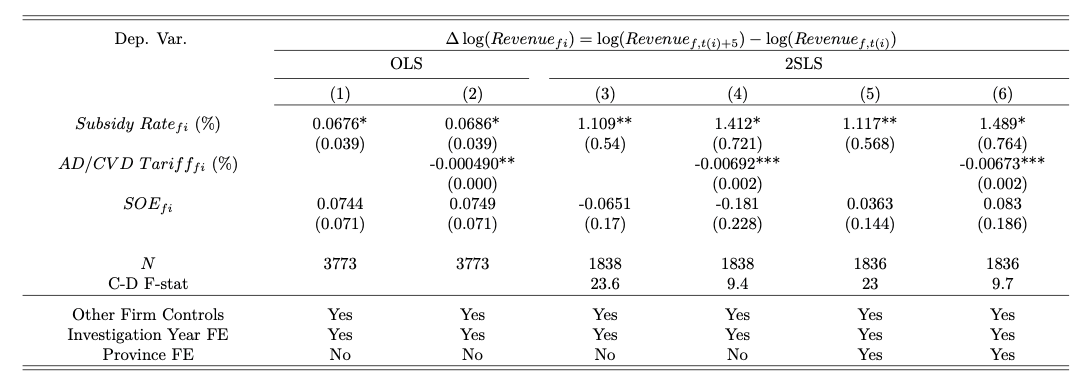
Notes: Robust standard errors clustered at the firm level are reported in parentheses below the coefficients. Asterisks denote significance levels∗ < 0.1, ∗∗ < 0.05, ∗∗∗ < 0.01.
Conclusion
Our findings reveal a hidden cost of industrial policy: under WTO rules, subsidies lead to more adverse outcomes at every stage of AD/CVD investigations. This mechanism helps explain the recent parallel rise of industrial subsidies and trade protection. The resulting tariffs offset about 25% of the subsidies’ positive effect on firm revenue growth. Despite its importance for the effectiveness of subsidies, this cost was largely overlooked as China designed its many industrial policies (Fang et al. 2025). Policymakers aiming to promote exports should consider how subsidy design shapes trade responses—targeting sectors that impose less foreign harm or relying on alternative, nonsubsidy tools that are less likely to trigger retaliation.
1 We acquire firm-level total subsidy revenue received from the government from ASIF for 2000–2008 and the STA for 2009–2016 (same as Aghion et al. 2015).
2 We avoid issues arising from sampling and measurement differences across the ASIF and STA datasets because we primarily rely on cross-sectional analysis: we compare investigation outcomes for highly subsidized firms against those for less subsidized firms, both within-investigation and across-investigations.
3 Subsidy rate, defined as the ratio of firm-level total subsidy revenue from the government to firm-level output, measures a firm’s subsidy intensity (following Aghion et al. 2015).
References
Aghion, Philippe, Jing Cai, Mathias Dewatripont, Luosha Du, Ann Harrison, and Patrick Legros. 2015. “Industrial Policy and Competition.” American Economic Journal: Macroeconomics 7 (4): 1–32. https://doi.org/10.1257/mac.20120103.
Bown, Chad, Milla Cieszkowsky, Aksel Erbahar, and Signoret, Jose. 2025. “Temporary Trade Barriers Database.” World Bank. https://www.worldbank.org/en/data/interactive/2021/03/02/temporary-trade-barriers-database.
Fang, Hanming, Ming Li, and Guangli Lu. 2025. “Decoding China’s Industrial Policies,” National Bureau of Economic Research Working Paper No. 33814. https://www.nber.org/papers/w33814.
Feng, Yusheng, Haishi Li, Siwei Wang, and Min Zhu. 2025. “Industrial Policy and Retaliatory Protection under the WTO: Lessons from China.” Social Science Research Network Working Paper No. 5343932. https://dx.doi.org/10.2139/ssrn.5343932.
Juhász, Réka, Nathan Lane, and Dani Rodrik. 2024. “The New Economics of Industrial Policy.” Annual Review of Economics 16: 213–42. https://doi.org/10.1146/annurev-economics-081023-024638.

Latest
Most Popular
- VoxChina Covid-19 Forum (Second Edition): China’s Post-Lockdown Economic Recovery VoxChina, Apr 18, 2020
- China’s Great Housing Boom Kaiji Chen, Yi Wen, Oct 11, 2017
- China’s Joint Venture Policy and the International Transfer of Technology Kun Jiang, Wolfgang Keller, Larry D. Qiu, William Ridley, Feb 06, 2019
- The Dark Side of the Chinese Fiscal Stimulus: Evidence from Local Government Debt Yi Huang, Marco Pagano, Ugo Panizza, Jun 28, 2017
- Wealth Redistribution in the Chinese Stock Market: the Role of Bubbles and Crashes Li An, Jiangze Bian, Dong Lou, Donghui Shi, Jul 01, 2020
- Evaluating Risk across Chinese Housing Markets Yongheng Deng, Joseph Gyourko, Jing Wu, Aug 02, 2017
- What Is Special about China’s Housing Boom? Edward L. Glaeser, Wei Huang, Yueran Ma, Andrei Shleifer, Jun 20, 2017
- Privatization and Productivity in China Yuyu Chen, Mitsuru Igami, Masayuki Sawada, Mo Xiao, Jan 31, 2018
- Daily Price Limits and the Magnet Effect Ting Chen, Zhenyu Gao, Jibao He, Wenxi Jiang, Wei Xiong, Oct 25, 2017
- How did China Move Up the Global Value Chains? Hiau Looi Kee, Heiwai Tang, Aug 30, 2017


