A Bridge on Economic Issues between China and the World


 Facebook
  Twitter
  Instagram
 WeChat
  Email
Email A New Method for Estimating Product-Level Emission Intensities and Implications for EU’s Carbon Border Adjustment Mechanism
We develop a new method for estimating product-level emission intensities (PLEI) by combining firm-level emissions with firm-product output data. This methodological innovation produces highly granular emission measures that are essential for both academic research and climate policy design. Applying the method to Chinese manufacturing data, we uncover stark heterogeneity: the top 10% of emission-intensive products account for 75% of emissions but only 4% of exports. We incorporate our PLEI estimates into a general equilibrium trade model to assess the EU’s Carbon Border Adjustment Mechanism (CBAM). Our simulations demonstrate that, at the same carbon price, product-level CBAM achieves substantially greater emissions reductions than sector-level CBAM, while causing markedly less trade disruption. These results underscore the importance of product-level emission intensity data in designing targeted and cost-effective climate policies.

As climate policy becomes increasingly intertwined with international trade, a pressing question has emerged in both academic and policy discussions: how can we best measure the carbon content of traded goods? The answer is central not only to debates over global emissions accounting, but also to the design of practical instruments like the European Union’s Carbon Border Adjustment Mechanism (CBAM), which aims to level the playing field by taxing imported goods based on their emissions content (Bellora and Fontagné, 2023; Fontagné and Schubert, 2023).
To date, most empirical studies and policy applications rely on emission intensity estimates at the industry or sector level. However, sector-level averages can obscure substantial heterogeneity across products, potentially leading to inefficiencies and distortions.
In this column, we present a new method for estimating product-level emission intensities (PLEI) using firm-product-level production data and firm-level emissions data. Our approach yields emission intensity measures at the HS 6-digit product level, distinguishing inherent product characteristics from firm-level variation in abatement and production efficiency. This methodological innovation advances the measurement of carbon content in traded goods for academic research and offers a practical foundation for designing more precisely targeted carbon pricing instruments such as the CBAM.
By applying our method to a large panel of Chinese manufacturing firms from 2000–2013, we document novel stylized facts about the distribution of emissions across products and simulate how alternative CBAM designs perform when armed with product-level rather than sector-level information.1 Our results show that product-level CBAM can achieve the same level of emissions reduction as sector-level CBAM at a much lower carbon price and with only a fraction of the associated trade loss, delivering both environmental effectiveness and economic efficiency.
A New Method to Estimate Product-Level Emission Intensities
A key innovation of our study is a fixed-point algorithm that estimates PLEI by jointly accounting for the inherent emissions associated with producing a given product and the environmental efficiency of the firm producing it. Specifically, we allocate firm-level emissions across products based on the PLEI and the firm-product level output. A firm's environmental efficiency is then defined as the ratio by which its observed emissions intensity falls below the level implied by its product mix.
This method improves on earlier approaches (e.g., Shapiro and Walker, 2018), which assign emissions to products based on revenue shares, implicitly assuming uniform emission intensities across a firm’s product mix. Monte Carlo simulations show the method is robust to measurement error and performs well even when firm-level inefficiencies vary across products.
For policymakers and scholars, this algorithm offers a replicable framework that can be applied wherever firm-level emissions and product-level output data are available. It generates granular estimates that enhance the precision of environmental accounting, support more rigorous empirical analysis on the environmental impact of globalization and inform the design of more targeted and effective environmental regulations.
Stylized Facts: Emissions Are Skewed, Concentrated, and Their Heterogeneity Is Masked by Aggregation
Applying this method to a linked dataset of Chinese firms covering the period 2000–2013, we generate PLEI estimates for approximately 4,500 HS 6-digit products across nine different pollutants. Several striking patterns emerge:
1. Emission intensities vary substantially across products.
The most emission-intensive products exhibit intensities that far exceed the median, with Gini coefficients for PLEI surpassing 0.95 across all pollutants. Figure 1 visualizes this stark inequality by plotting emission intensities in descending order, normalizing the dirtiest product to 100. The curve drops off rapidly, and beyond the top 1% of products — roughly 40 HS 6-digit codes — emission intensities become negligible by comparison.
Figure 1: Skewness of Emission Intensities across 6-digit HS Code Products
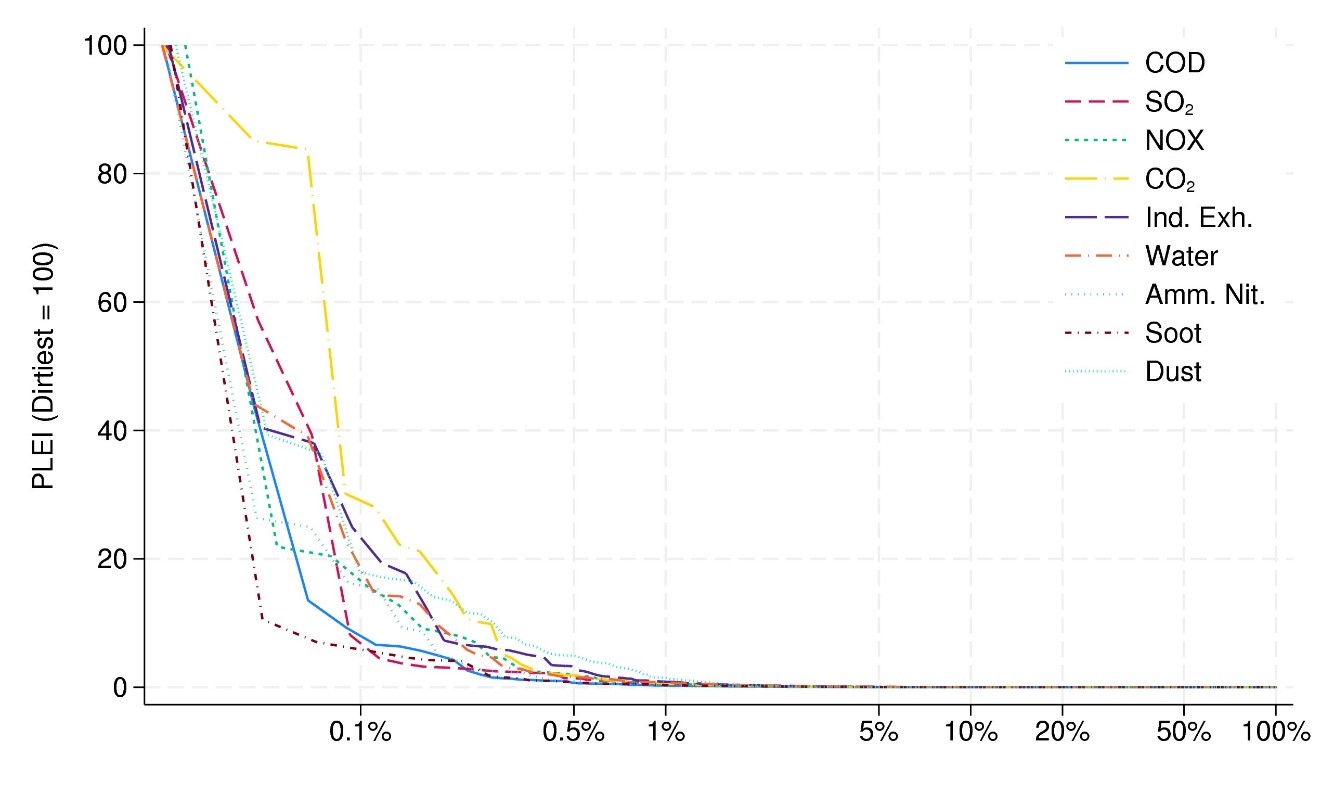
Notes: This figure illustrates the total emission intensities of HS 6-digit products in descending order. The highest value is normalized to 100 for each pollutant. The horizontal axis shows each product’s emission intensity rank percentile on a log scale.
2. A small number of products account for the vast majority of emissions.
Table 1 ranks HS 6-digit products by their emission intensities and reports the corresponding shares of total emissions and export value for each group. The results reveal a striking concentration: the top 10% most emission-intensive products account for a staggering 75% of total emissions embodied in China’s exports, yet constitute only about 4% of China’s export value. This sharp imbalance suggests that targeted environmental policies — focused on a narrow set of emission-intensive goods — can achieve substantial emission reductions with minimal disruption to trade.
Table 1: Percentage of Total Emissions and Exports Accounted for by the Most Emission-Intensive Products
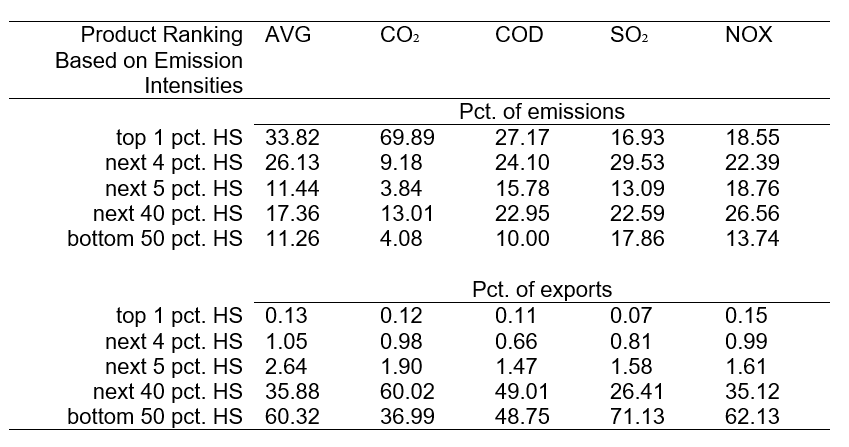
Notes: The table provides a breakdown of emissions and export value accounted for by the most emission-intensive products, classified at the HS 6-digit product groups. For brevity, we report the average across nine pollutants (AVG) along with four representative pollutants. For the complete table covering all nine pollutants, see Table 3 in Kwon et al. (2025).
3. Sector-level averages conceal critical product-level differences in emission intensities.
Aggregating to HS 2-digit or industry-level categories conceals the substantial heterogeneity in emission intensities across products. As illustrated in Figure 2, approximately 80% of CO₂ emissions are concentrated in just 3% of exports when measured at the product level, compared to nearly 30% of exports when measured at the sector level. This stark difference highlights the importance of using PLEI over sector-level averages — both for improving the precision of empirical research and for designing more effective and targeted climate policies.
Figure 2: Cumulative Distribution of CO2 Emissions and Trade Volume by Emission Intensity
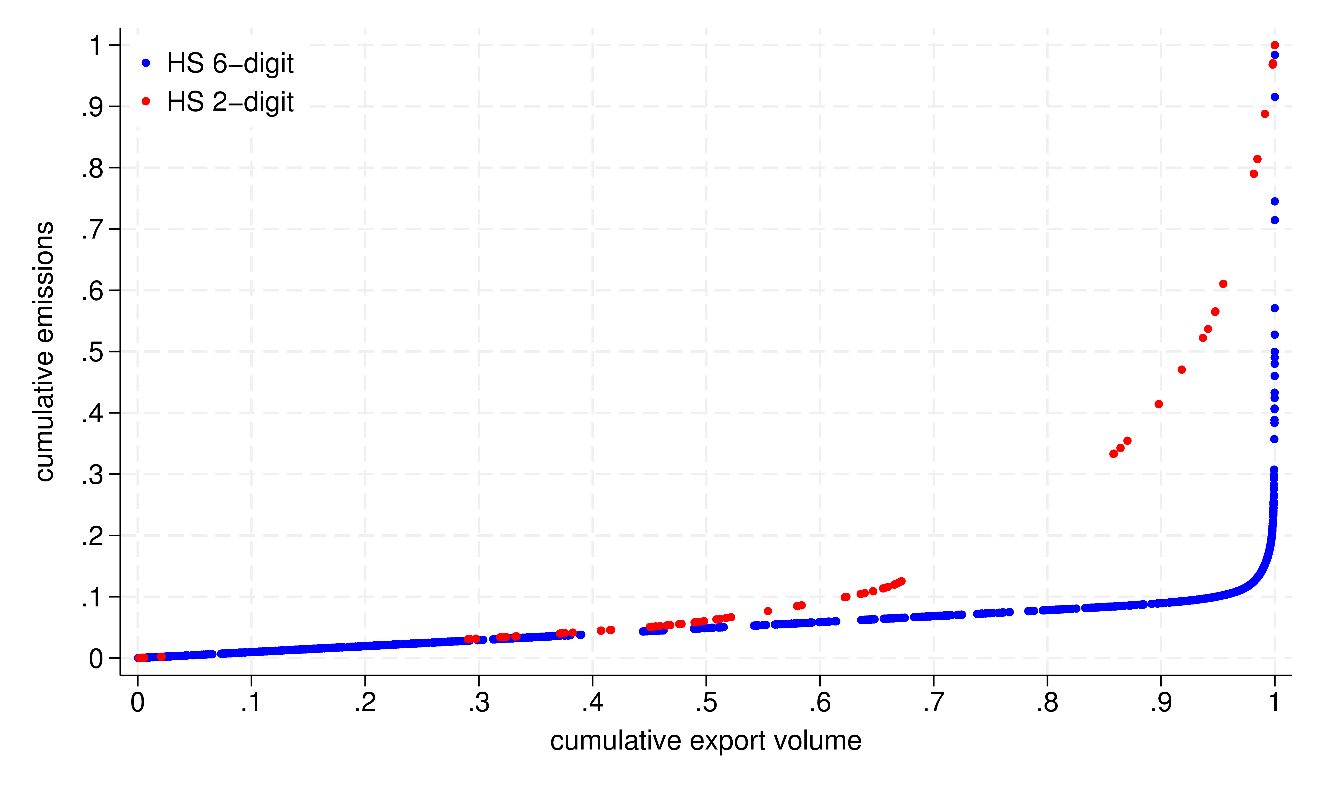
Notes: This figure shows the cumulative distributions of total CO2 emissions and export volumes across HS 2-digit sectors and 6-digit products. Sectors and products are sorted in increasing order based on their total emission intensities.
Reassessing CBAM Design with PLEI
To evaluate how PLEI can inform better climate policy, we incorporate our PLEI measures into a multi-country, general equilibrium trade model adapted from Caliendo and Parro (2015) and Duan et al. (2021). The model features emissions as a factor of production in the style of Copeland and Taylor (2003) and incorporates input-output linkages, tariffs based on carbon content, and endogenous trade flows.
We simulate two CBAM regimes targeting EU’s imports from China:
• Sector-level CBAM imposes tariffs on Chinese imports based on sectoral average emission intensities.
• Product-level CBAM uses our PLEI estimates to levy tariffs that reflect emissions at the product level.
In both cases, the EU applies a uniform carbon price to Chinese imports, while holding constant the trade costs with all other countries.
Figure 3 illustrates the resulting emission and export volume reductions at different carbon price levels. For instance, to achieve roughly a 40% reduction in emissions embodied in China-EU trade, sector-level CBAM (black line) requires a carbon price of $80/ton and reduces trade volume by nearly 5%. In contrast, product-level CBAM (blue line) achieves the same emissions reduction with a carbon price of only $4/ton, causing just a 0.2% drop in trade volume.2
Figure 3: Sector-Level vs. Product-Level CBAM: Reduction in Trade and Emissions
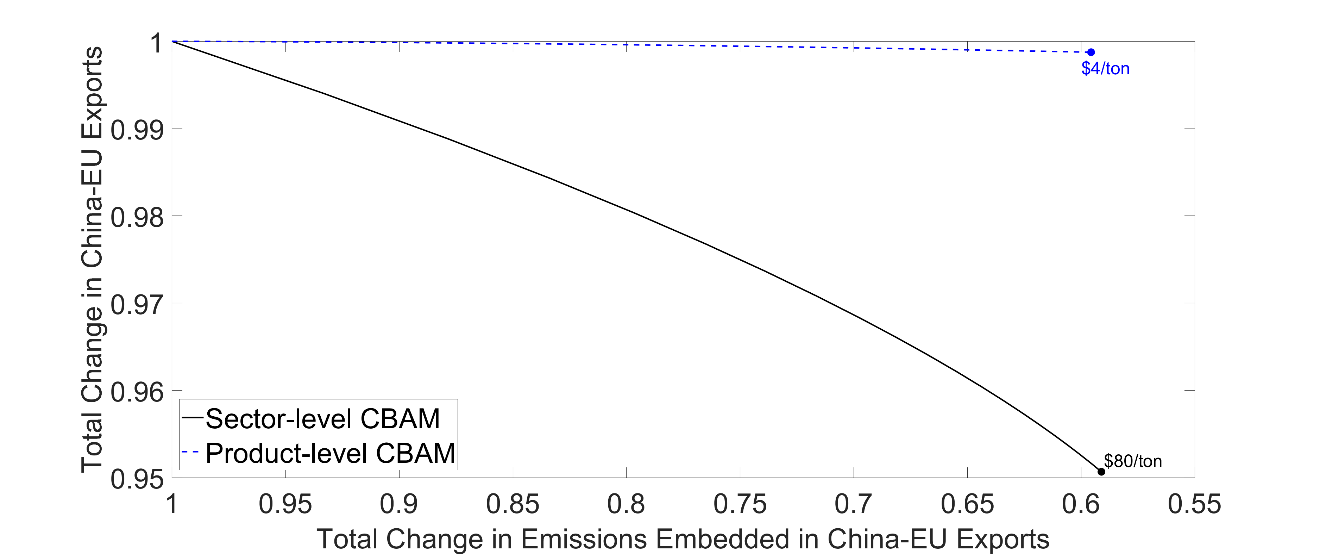
Notes: This figure compares the outcomes of sector- and product-level CBAM policies in terms of reductions in emissions embedded in China-EU trade and the corresponding declines in trade volume.
This efficiency gain is driven by precise targeting: high-PLEI products receive higher tariffs, while clean products within dirty sectors are spared. Sector-level CBAM lacks this granularity, resulting in over-taxation of clean products within emission-intensive industries and under-taxation of emission-intensive products embedded in clean sectors.
Implications on Real Consumption
Using real consumption as a proxy for welfare, Kwon et al. (2025) shows that China’s welfare loss under product-level CBAM is approximately 26% of that under sector-level CBAM at the same carbon price of $80/ton. For the EU, sector-level CBAM offers slightly greater consumption gains due to terms-of-trade gains and broader tariff coverage (Ossa (2014); Bagwell et al. (2021)), but at the cost of reduced environmental effectiveness.
Implications for Research and Policy
Our method and findings contribute to a growing body of work on environmental regulation in global trade. We offer two key takeaways for researchers and policymakers:
1. Granular measurement improves both empirical research and policy design.
Our PLEI estimates allow researchers to identify composition effects that were previously masked by aggregation. This opens the door to improved empirical strategies in the trade-environment literature, including tests of the pollution haven hypothesis and the effectiveness of trade-linked environmental policies.
2. CBAM should prioritize a product-level approach.
Designing border carbon adjustments based on sector averages introduces inefficiencies by ignoring within-industry heterogeneity. With product-level data, policymakers can more accurately align tariffs with emission intensities, thereby maximizing emissions reduction while minimizing economic distortion.
Conclusion
This study introduces and validates a novel method for estimating product-level emission intensities — an innovation that has substantial implications for both academic research and climate policy. By enabling researchers and governments to move beyond sector-level averages, our approach reveals the hidden heterogeneity in emissions and unlocks more effective pathways for decarbonizing trade.
A limitation of our analysis is that the counterfactual policy simulation is conducted in the short run, holding constant both the PLEI and firm-level emission efficiencies, thereby attributing emissions reductions exclusively to intensive-margin adjustments in product quantities. After the implementation of CBAM in 2026, it will be important to assess whether the policy incentivizes cleaner production either at the product level or across firms.
1 Environmental emissions in China have garnered significant attention in recent years (Greenstone et al., 2021; Fan et al., 2020), yet there remains limited evidence on how alternative CBAM designs may differentially affect China’s trade with the EU.
2 In Kwon et al. (2025), we show that product-level CBAM achieves 88.7% emissions reduction with only a 1.16% drop in trade at the carbon price of $80/ton.
References
Bagwell, Kyle, Robert W. Staiger, and Ali Yurukoglu. 2021. “Quantitative Analysis of Multiparty Tariff Negotiations.” Econometrica 89 (4): 1595–1631.
Bellora, Cecilia, and Lionel Fontagné. 2023. “EU in Search of a Carbon Border Adjustment Mechanism.” Energy Economics 123 (July):106673.
Caliendo, Lorenzo, and Fernando Parro. 2015. “Estimates of the Trade and Welfare Effects of NAFTA.” The Review of Economic Studies 82 (1): 1–44.
Copeland, Brian R., and M. Scott Taylor. 2003. “Trade and the Environment: Theory and Evidence.” In Trade and the Environment. Princeton University Press.
Duan, Yuwan, Ting Ji, Yi Lu, and Siying Wang. 2021. “Environmental Regulations and International Trade: A Quantitative Economic Analysis of World Pollution Emissions.” Journal of Public Economics 203 (November):104521.
Fan, Haichao, Joshua S. Graff Zivin, Zonglai Kou, Xueyue Liu, and Huanhuan Wang. 2020. “Going Green in China: Firms’ Responses to Stricter Environmental Regulations.” VoxChina.org.
Fontagné, Lionel, and Katheline Schubert. 2023. “The Economics of Border Carbon Adjustment: Rationale and Impacts of Compensating for Carbon at the Border.” Annual Review of Economics 15 (Volume 15, 2023): 389–424.
Greenstone, Michael, Guojun He, Shanjun Li, and Eric Zou. 2021. “China’s War on Pollution: A Review of Evidence from the First Five Years.” VoxChina.org.
Kwon, Ohyun, Hao Zhao, and Min Qiang Zhao. 2025. “Product Level Emission Intensities: Measurement and Application to the CBAM.” School of Economics Working Paper Series, LeBow College of Business, Drexel University.
Ossa, Ralph. 2014. “Trade Wars and Trade Talks with Data.” American Economic Review 104 (12): 4104–46.
Shapiro, Joseph S., and Reed Walker. 2018. “Why Is Pollution from US Manufacturing Declining? The Roles of Environmental Regulation, Productivity, and Trade.” American Economic Review 108 (12): 3814–54.

Latest
Most Popular
- VoxChina Covid-19 Forum (Second Edition): China’s Post-Lockdown Economic Recovery VoxChina, Apr 18, 2020
- China’s Great Housing Boom Kaiji Chen, Yi Wen, Oct 11, 2017
- China’s Joint Venture Policy and the International Transfer of Technology Kun Jiang, Wolfgang Keller, Larry D. Qiu, William Ridley, Feb 06, 2019
- The Dark Side of the Chinese Fiscal Stimulus: Evidence from Local Government Debt Yi Huang, Marco Pagano, Ugo Panizza, Jun 28, 2017
- Wealth Redistribution in the Chinese Stock Market: the Role of Bubbles and Crashes Li An, Jiangze Bian, Dong Lou, Donghui Shi, Jul 01, 2020
- Evaluating Risk across Chinese Housing Markets Yongheng Deng, Joseph Gyourko, Jing Wu, Aug 02, 2017
- What Is Special about China’s Housing Boom? Edward L. Glaeser, Wei Huang, Yueran Ma, Andrei Shleifer, Jun 20, 2017
- Privatization and Productivity in China Yuyu Chen, Mitsuru Igami, Masayuki Sawada, Mo Xiao, Jan 31, 2018
- Daily Price Limits and the Magnet Effect Ting Chen, Zhenyu Gao, Jibao He, Wenxi Jiang, Wei Xiong, Oct 25, 2017
- How did China Move Up the Global Value Chains? Hiau Looi Kee, Heiwai Tang, Aug 30, 2017


