Industrial Policy: Lessons from Shipbuilding
Industrial policy has been used by many countries throughout history. Yet, it remains one of the most contentious issues among policymakers and economists. We outline a theory-based empirical methodology that relies on estimating an industry equilibrium model to measure hidden subsidies, assess their welfare consequences for the domestic and global economy, and evaluate the effectiveness of different policy designs. We use our methodology on China’s recent policies to promote its shipbuilding industry to dissect the impact of such programs, what made them more or less successful, and how we can justify why governments have chosen shipbuilding as a target.

Industrial policy (IP) refers to a government agenda to shape industry structure by promoting certain industries or sectors. Although casual observation suggests that IP can boost sectoral growth, researchers and policymakers have not yet mastered the prediction or evaluation of the efficacy of different types of government interventions, or the measurement the overall short-run and long-run welfare effects (Juhász, Lane, and Rodrik 2023: Millot and Rawdanowicz 2024). In this article, we focus on one particular example of IP: the shipbuilding sector.
The history of shipbuilding is as tumultuous as the seas themselves. Shipbuilding has always held an allure for governments, in its real and perceived interactions with industrialization, maritime trade, and military strength (Stopford 2009). Figure 1 shows the succession of the world’s dominant shipbuilding nations. The United Kingdom held the lion’s share of the industry for the better part of the 19th and 20th centuries, fending off competition from other Western European economies (mainly Germany and Scandinavia) at times. After World War II, the UK was swiftly overtaken by Japan, which prevailed until the 1980s, when South Korea began to dominate the global market.
Figure 1. Share of commercial ships produced by each country, 1892–2014.
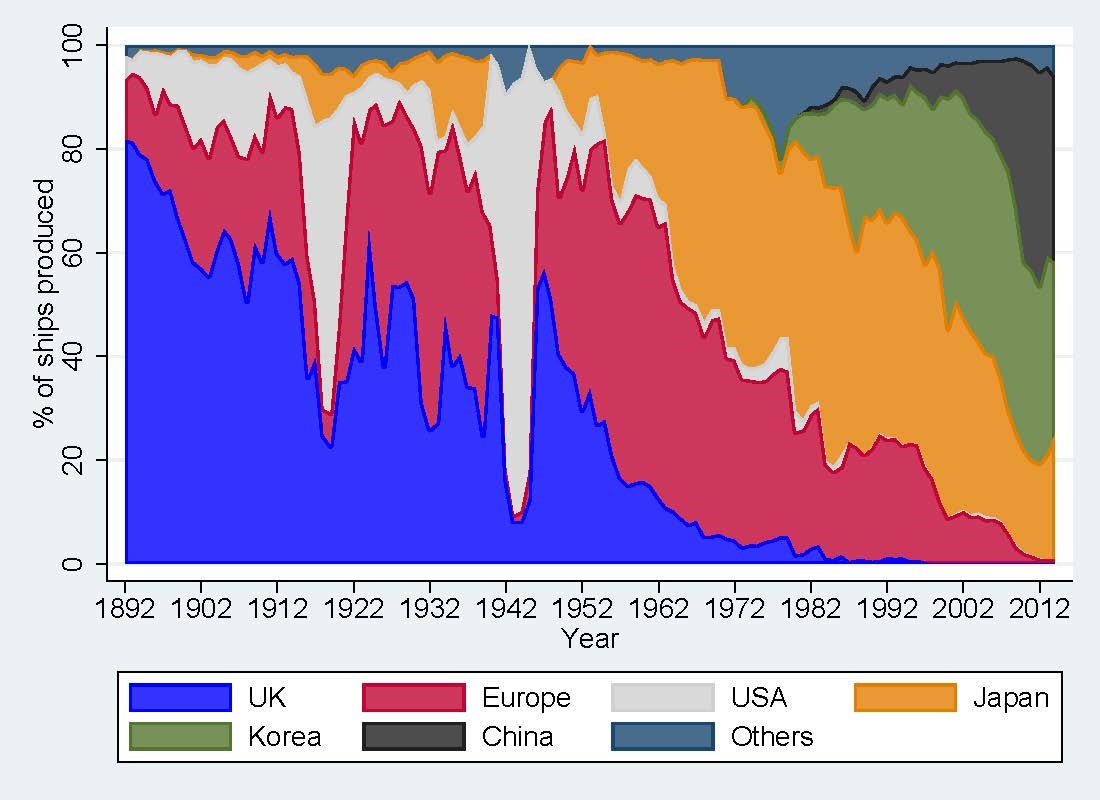
Note: This figure plots the world market share in terms of the number of ships delivered from 1892 to 2014 for major ship producing countries. Source: Data for 1892–1997 was obtained from historical issues of the World Fleet Statistics published by Lloyd’s Register, while the data from 1998 onward is from Clarksons. We group all European shipbuilding countries, except the United Kingdom, under “Europe.”
In the 2000s, China entered the shipbuilding scene. In 2002, former Premier Zhu inspected the China State Shipbuilding Corporation (CSSC), one of the two largest Chinese shipbuilding conglomerates, and pointed out that “China hopes to become the world’s largest shipbuilding country (in terms of output) [...] by 2015.” Within a few years, China had overtaken Japan and South Korea to become the world’s leading ship producer in terms of output. Figure 2, Panel A shows the rise in China’s global market share of shipbuilding by plotting China’s total shipbuilding output as a share of global output. China’s national and local governments provided numerous subsidies for shipbuilding, which we classify into three groups.
First, below-market-rate land prices along the coastal regions, in combination with simplified licensing procedures, acted as “entry subsidies” that incentivized the creation of new shipyards. As shown in Figure 2, Panel B, between 2006 and 2008, the annual construction of new shipyards in China exceeded 30 per year; in comparison, during the same time period, Japan and South Korea averaged only about one new shipyard per year each. Second, regional governments set up dedicated banks to provide shipyards with “investment subsidies” in the form of favorable financing, including low-interest, long-term loans (a common IP tool, illustrated also by programs in Japan and South Korea) and preferential tax policies. China’s rise in total capital invested in shipyards is illustrated in Figure 2, Panel C. Third, China’s government also employed “production subsidies” of various forms, such as subsidized material inputs, export credits, and buyer financing. The government-buttressed domestic steel industry provided cheap steel, which is an important input for shipbuilding. Export credits and buyer financing by government-directed banks made the new and unfamiliar Chinese shipyards more attractive to global buyers.
Figure 2. The Rapid Expansion of China’s Shipbuilding Industry
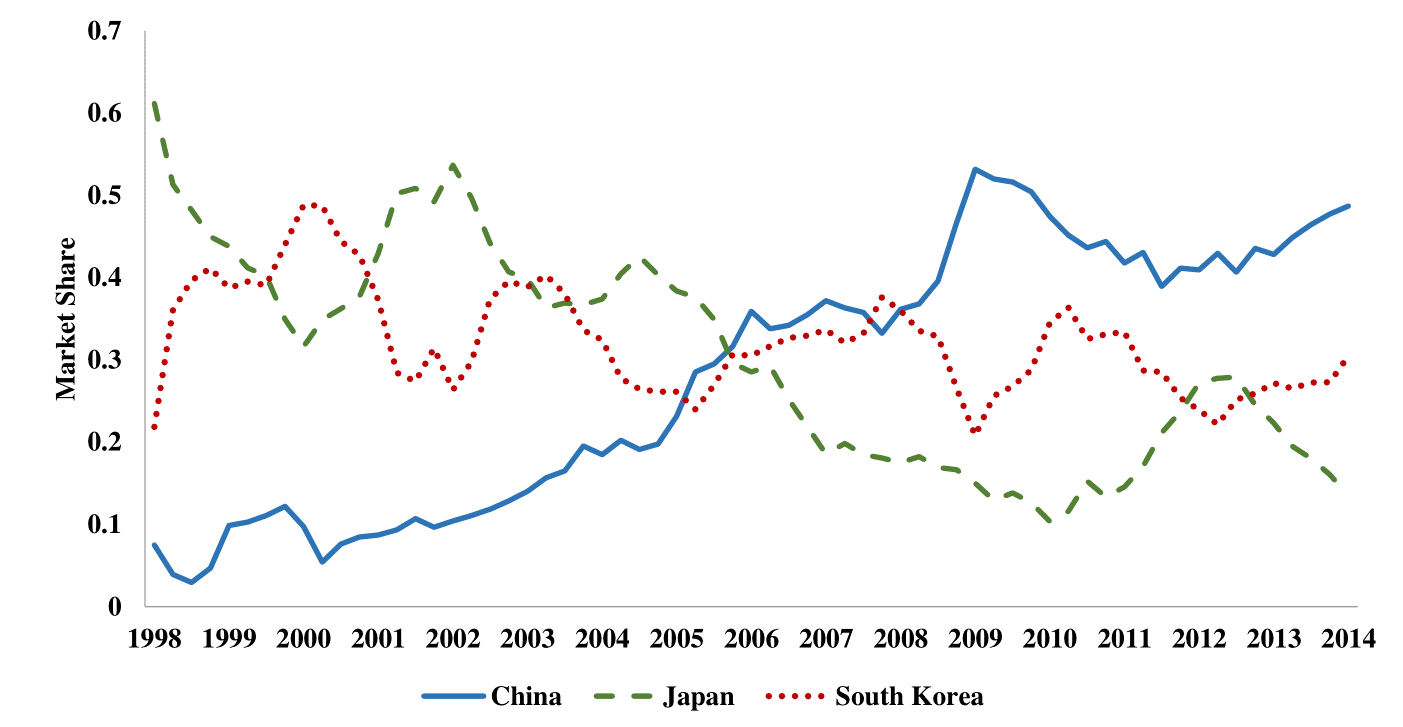
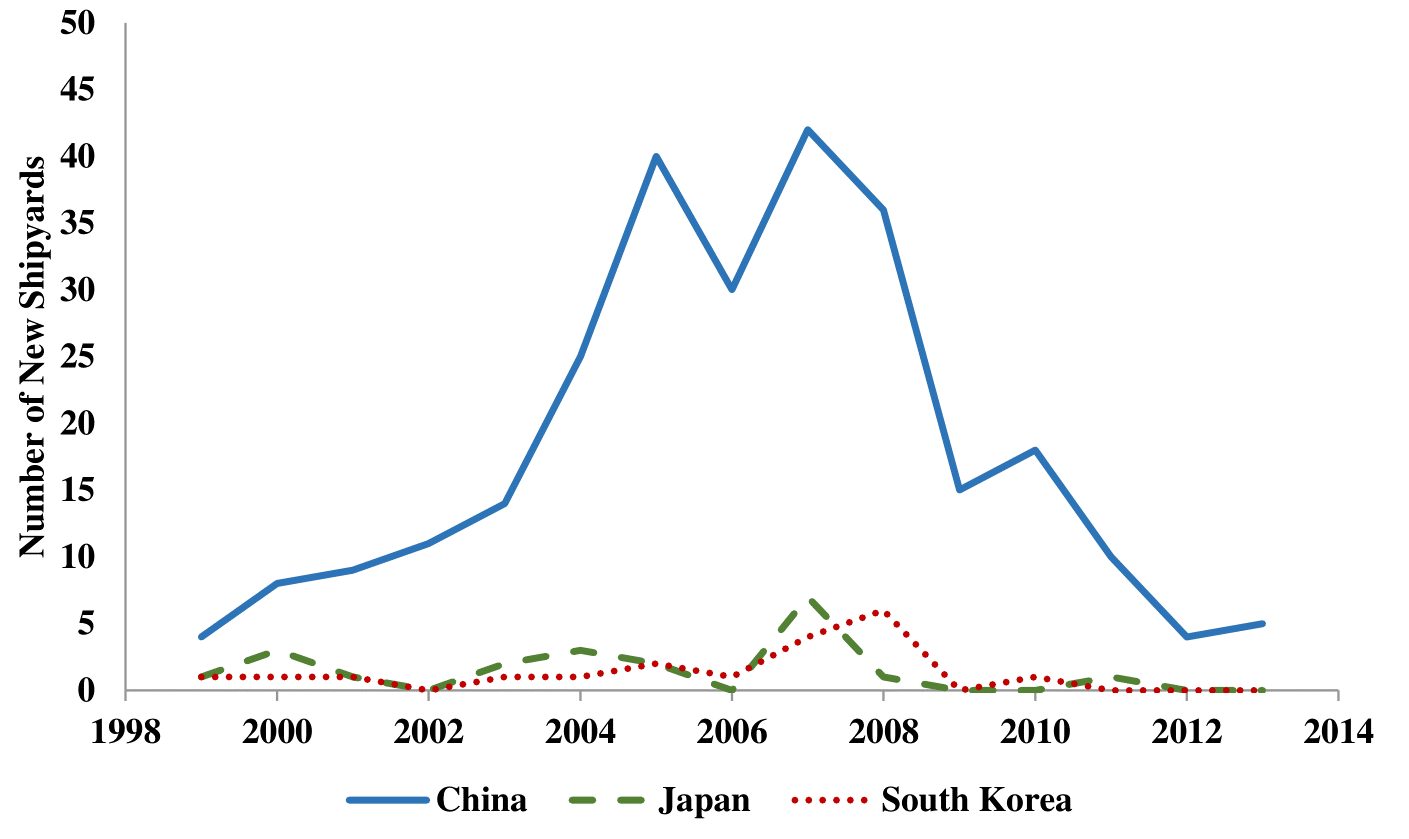
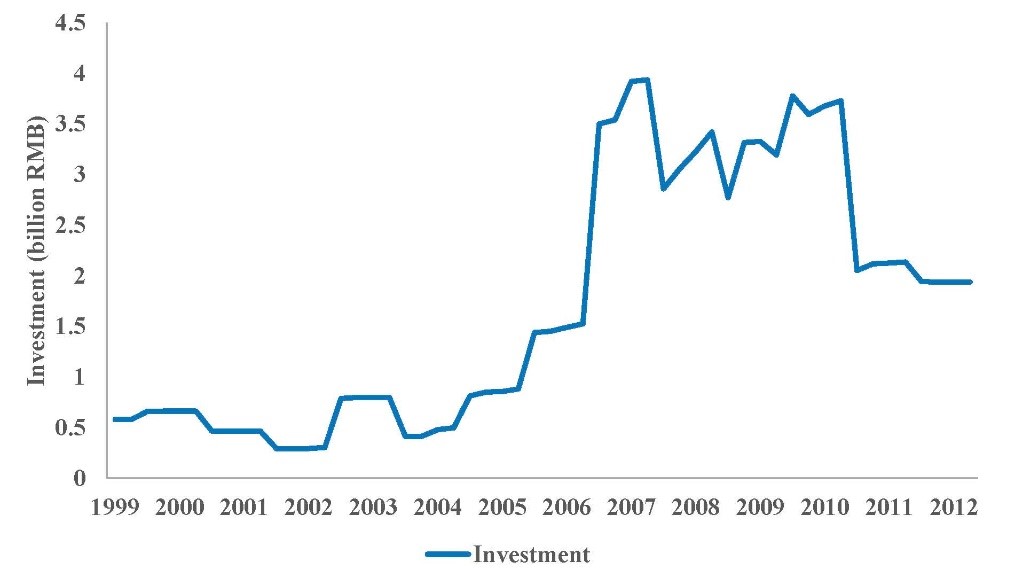
Notes: Market share by country is computed from quarterly ship orders. The number of new shipyards is computed annually and by country. Industry aggregate quarterly investment by Chinese shipyards is measured in billions of 2000 yuan. Source: Barwick, Kalouptsidi, and Zahur (2024), using data from Clarksons and China’s National Bureau of Statistics.
The combination of these policies was followed by a sharp expansion in China’s shipbuilding production, market share, and capital accumulation. China’s market share grew from 14% in 2003 to 53% by 2009, while Japan’s shrunk from 32% to 10% and South Korea’s from 42% to 32%. Then came the Great Recession of 2008–9, which drove the global shipping industry to a historic bust. The large number of new Chinese shipyards exacerbated low capacity utilization and contributed to plummeting ship prices around the world. The effectiveness of China’s IP was questioned. In response to the crisis and in an effort to promote industry consolidation, the government unveiled the “2009 Plan on Adjusting and Revitalizing the Shipbuilding Industry,” which resulted in an immediate moratorium on entry and subsequently shifted support to selected firms in an issued “white list.”
Kalouptsidi (2014) and Barwick, Kalouptsidi, and Zahur (2024) study the impact of China’s 21st-century shipbuilding program on industry evolution and global welfare. To our knowledge, this work is the first to evaluate quantitatively IP in shipbuilding globally and among the first employing the structural industrial organization methodology to understand the welfare implications and effective design of IP more generally.
We build a model that is flexible enough to capture rich dynamic features of a global market for ships. On the demand side, a large number of shipowners across the world decide whether to buy new vessels. Their willingness to pay for new ships depends on present and expected future market conditions, notably world trade and the current fleet level. On the supply side, shipyards located in China, Japan, and South Korea (which account for 90% of world production) decide how many ships to produce, by comparing the market price of a ship and its production costs. In addition, shipyards decide whether to enter by comparing their lifetime expected profitability to entry costs, which include the costs to set up a new firm (such as the cost of land acquisition, shipyard construction, and any initial capital investments) and the implicit cost of obtaining regulatory permits. They exit if expected profitability from remaining in the industry falls below a given threshold, capturing the shipyard’s “scrap” value (that is, the proceeds from liquidating the business, as well as any option values of the firm). Firms also invest to expand future production capacities. For estimation, we employ a rich dataset consisting of firm-level quarterly ship production between 1998 and 2014, firm-level investment, entry and exit, and new ship market prices by ship type (containerships, tankers, and dry bulk carriers, which together account for 90% of global sales).
Our estimates suggest that China provided $23 billion in production subsidies between 2006 and 2013. This finding is driven by the cost function obtained from this analysis, which exhibits a significant drop for Chinese producers equal to about 13–20% of the cost per ship. Simply put, Chinese shipbuilding firms were “over”-producing after 2006 compared to our prediction of output without subsidies. Altogether, China provided $91 billion in subsidies along all three margins—production, entry, and investment—between 2006 and 2013. Notably, entry subsidies were 69% of total subsidies, while production subsidies were 25%, and investment subsidies accounted for the remaining 6%. These estimates reflect the fact that shipbuilding firms “over-entered” (recall the astonishing entry rates during the boom years of 2006–8) and “over-invested” (recall the striking increase in investment during the bust) as shown earlier in Figure 2.
Our structural model suggests that China’s IP in support of shipbuilding boosted the country’s domestic investment in shipbuilding by 140%, and more than doubled the entry rate. It also depressed exit. Overall, IP raised China’s world market share in shipbuilding by more than 40%.
Calculating whether this increase in sectoral output should be counted as an increase in welfare is a more delicate question. First, 70% of China’s output expansion occurred via business stealing from rival countries. There is evidence (backed by our cost estimates) that Chinese shipyards are less efficient than their Japanese and South Korean counterparts; thus, the transfer of shipbuilding to China constitutes a misallocation of global resources. Second, China’s IP for shipbuilding led to considerable declines in ship prices. Lower ship prices benefited world ship-buyers somewhat, though only a modest amount accrues to Chinese ship-buyers, as they accounted for a small fraction of the world fleet. Third, and most importantly, although China’s shipbuilding subsidies were highly effective at achieving output growth and market share expansion, they were largely unsuccessful in terms of (domestic) welfare measures. The program generated modest gains in domestic producers’ profit and domestic consumer surplus. In the long run, the gross return rate of the adopted policy mix, as measured by the increase in lifetime profits of domestic firms divided by total subsidies, is only 18%, meaning that for every $1 the government spends, it gets back 18 cents in profitability. In other words, the net return when incorporating the cost to the government was a negative 82%, with entry subsidies explaining a lion’s share of the negative return.
Entry subsidies are wasteful—even by the revenue metric—and lead to increased industry frag- mentation and idleness. Entry subsidies attract small and inefficient firms. In contrast, production and investment subsidies increase the backlog and capital stock, which lead to economies of scale and drive down both current and future production costs. As such, they favor large and efficient firms. Indeed, the take-up rate for production and investment subsidies is much higher among efficient firms: 82% of production subsidies and 68% of investment subsidies are allocated to firms that are more efficient than the median firm, whereas only 49% of entry subsidies goes to more efficient firms.
In terms of policy design, a counter-cyclical policy would outperform the pro-cyclical policy that was adopted by a large margin: strikingly, subsidizing firms in production and investment during the boom leads to a gross rate of return of only 38% (a net return of -62%), whereas subsidizing firms during the downturn leads to a much higher gross return of 70% (a net return of -30%). Moreover, if a white list is formed—that is, the most productive firms are chosen for subsidies—the gross rate of return would climb to 71%.
Our results highlight why industrial policies have worked better for some countries. In East Asian countries where IP was often considered successful, the policy support was often conditioned on firm performance. In contrast, in Latin America, where industrial policies were often aimed at import-substitution, no mechanisms existed to weed out non-performing beneficiaries (Rodrik 2009). In China’s modern-day IP in the shipbuilding industry, the policy’s return was low early on, when output expansion was primarily fueled by the entry of inefficient firms, but increased over time as the government relied on “performance-based” criteria via its white list. Such targeted IP design can be substantially more successful than open-ended policies that benefit all firms.
In terms of the rationale—why China subsidized shipbuilding—the standard arguments for IP do not seem to apply especially well in our setting. The shipbuilding industry is fragmented globally, market power is limited, and markups are slim; thus, there are no “rents on the table” that, when shifted from foreign to domestic firms, outweigh the cost of subsidies. We find little evidence of learning by doing, perhaps because the production technology for the ship types that China expanded the most, such as bulk ships, was already mature. Spillovers to other domestic sectors are limited; in addition, more than 80% of ships produced in China are exported, which limits the fraction of subsidy benefits that is captured domestically. A scenario whereby Chinese output growth forces competitors to exit does not seem first-order either: by 2023, no substantial foreign exit occurred.
Our analyses point to two alternative potential rationales. First, as China became the world’s biggest exporter and a close second largest importer during our sample period, transport cost reductions from increased shipbuilding and reduced shipping costs led to substantial increases in its trade volume. Our estimates suggest that China’s IP policy expanded global shipping fleet, reduced freight rate, and raised China’s annual trade volume by 5% ($144 billion) between 2006 and 2013. This increase in trade was large relative to the size of the subsidies (which averaged $11.3 billion annually between 2006 and 2013). Of course, “more trade” does not translate directly into economic well-being, but the relative magnitudes are suggestive. Second, both military and commercial deliveries at shipyards that produce military ships experienced a multifold increase, although military production appeared to have accelerated after the financial crisis and continued to increase throughout the sample period, providing suggestive evidence that China’s supportive policy might have benefited its military production as well.
References
Barwick, Panle Jia, Myrto Kalouptsidi, and Nahim Bin Zahur. 2024. “Industrial Policy Implementation: Empirical Evidence from China’s shipbuilding Industry.” Review of Economic Studies. Forthcoming.
Juhász, Réka, Nathan Lane, and Dani Rodrik. 2023. “The New Economics of Industrial Policy.” Annual Review of Economics 16: 213–42. https://doi.org/10.1146/annurev-economics-081023-024638.
Kalouptsidi, Myrto. 2014. “Time to Build and Fluctuations in Bulk Shipping.” American Economic Review 104 (2): 564–608. https://doi.org/10.1257/aer.104.2.564.
Millot, Valentine, and Lukasz Rawdanowicz. 2024. “The Return of Industrial Policies.” VoxEU, July 1. https://cepr.org/voxeu/columns/return-industrial-policies.
Rodrik, Dani. 2009. “Industrial Policy: Don’t Ask Why, Ask How.” Middle East Development Journal 1 (1): 1–29. https://doi.org/10.1142/S1793812009000024.
Stopford, Martin. 2009. Maritime Economics. New York: Routledge.

Latest
Most Popular
- VoxChina Covid-19 Forum (Second Edition): China’s Post-Lockdown Economic Recovery VoxChina, Apr 18, 2020
- China’s Great Housing Boom Kaiji Chen, Yi Wen, Oct 11, 2017
- China’s Joint Venture Policy and the International Transfer of Technology Kun Jiang, Wolfgang Keller, Larry D. Qiu, William Ridley, Feb 06, 2019
- The Dark Side of the Chinese Fiscal Stimulus: Evidence from Local Government Debt Yi Huang, Marco Pagano, Ugo Panizza, Jun 28, 2017
- Wealth Redistribution in the Chinese Stock Market: the Role of Bubbles and Crashes Li An, Jiangze Bian, Dong Lou, Donghui Shi, Jul 01, 2020
- What Is Special about China’s Housing Boom? Edward L. Glaeser, Wei Huang, Yueran Ma, Andrei Shleifer, Jun 20, 2017
- Evaluating Risk across Chinese Housing Markets Yongheng Deng, Joseph Gyourko, Jing Wu, Aug 02, 2017
- Privatization and Productivity in China Yuyu Chen, Mitsuru Igami, Masayuki Sawada, Mo Xiao, Jan 31, 2018
- How did China Move Up the Global Value Chains? Hiau Looi Kee, Heiwai Tang, Aug 30, 2017
- China’s Shadow Banking Sector: Wealth Management Products and Issuing Banks Viral V. Acharya, Jun Qian, Zhishu Yang, Aug 09, 2017


 Facebook
  Twitter
  Instagram
 WeChat
  Email
Email 


