A Bridge on Economic Issues between China and the World


 Facebook
  Twitter
  Instagram
 WeChat
  Email
Email Air Pollution, Health Spending and Willingness to Pay for Clean Air in China

A study shows that reducing PM2.5 in China can lead to significant health benefit. A reduction of PM2.5 by 10 μg/m3 (about 20% from the current level) could result in an annual saving of 75 billion Yuan (or over 2%) in healthcare expenditure. The benefit from improved air quality proposed by recent national policies in China could justify large investment in cleanup activities.
Due to increased pressure from economic development and lax environmental regulations, developing countries and especially emerging economies such as China and India are experiencing the worst air pollution in history. According to the global urban ambient air pollution database compiled by the World Health Organization (hereafter WHO), in 2016, the top twenty most polluted cities in terms of PM2.5 are all from developing countries, including China, India, Iran, Pakistan, and the Philippines. An alarming 98% of cities in low- and middle-income countries with more than 100,000 residents fall short of meeting WHO’s air quality guidelines. As urbanization continues and development pressure increases, air pollution could further deteriorate before it improves. This is especially concerning given the size of the populations affected and the lack of access to adequate health care in these countries.
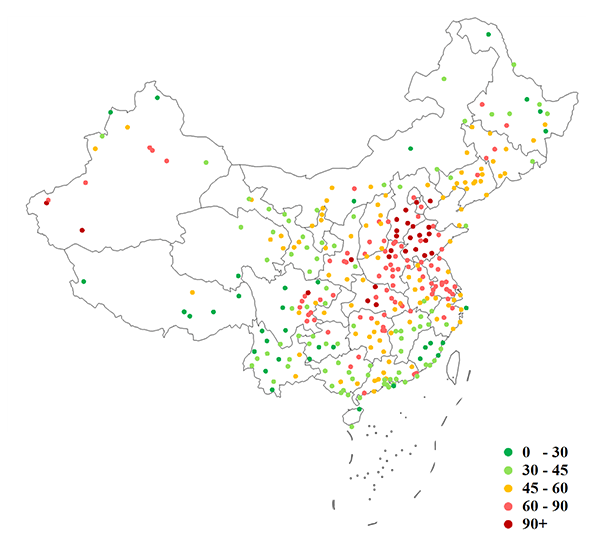
Figure 1 maps the three-year average level of PM2.5 for major Chinese cities from 2013 to 2015. The nationwide average is around 56 μg/m3, and the air pollution for most cities is substantially worse than the annual standard of 12 μg/m3 set by the U.S. Environmental Protection Agency (henceforth EPA), or that set by the Chinese Ministry of Environmental Protection (35 μg/m3). Of the thirteen largest cities with a population greater than 10 million, the average PM2.5 concentration is 73 μg/m3, 30% higher than the national average.
Rich literature from epidemiology, and more recently economics, has consistently shown a positive correlation between exposure to air pollution and an increase in mortality and morbidity risks in developed countries (Brunekreef and Holgate, 2002; Pope and Dockery, 2012). These findings have provided guidance on air quality regulations such as setting or tightening ambient air quality standards. Studies on particulate matters, for example, have led the U.S. EPA to establish standards for PM10 in 1987 and for PM2.5 in 1997 (Dockery, 2009).
While policy makers in developing countries are increasingly aware of the negative impacts of air pollution on human health and the quality of life, and they have been adopting various environmental regulations, few such policies are based on rigorous empirical analysis using data from these developing countries.
In a recent study by Barwick et al. (2017), we conduct one of the first national-level analyses of the impact of air pollution on health spending in a developing country context, and provide a lower bound estimate of Chinese consumers’ willingness to pay for improved air quality that can be used as an input for the cost-benefit analysis of environmental regulations. This study combines comprehensive hourly air pollution readings from all monitoring stations in China from 2013 to 2015 with the health expenditure data from the universe of credit card and debit card transactions from 2.7 billion cards in China during the same period. Fifty percent of the total health expenditure in 2015 was through credit and debit cards. Exploiting weather data on wind speed and direction, we construct for each city the amount of pollution that is imported from other areas (illustrated in Figure 2). This serves as an exogenous shock to local pollution in our quasi-experimental research design. In Beijing, for example, 40% to 55% of PM2.5 originates from surrounding industrial cities, while pollution for smaller cities is mostly local.
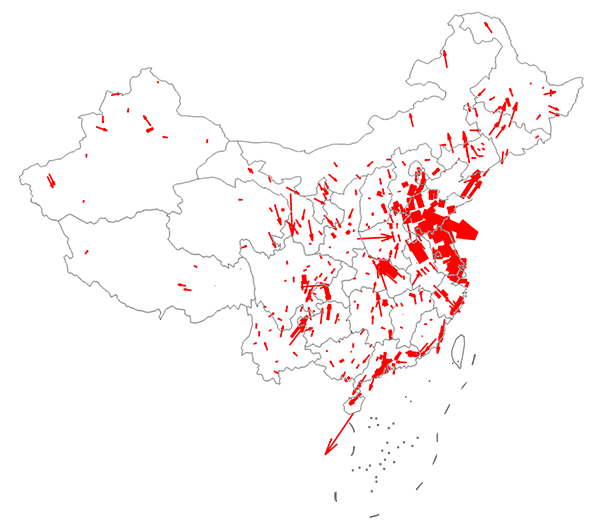
Figure 3 depicts the time path of the estimated causal impact on health spending from a 10 μg/m3 increase in PM2.5. Solid segments of the line indicate statistical significance at the 5% level. Health spending increases significantly during the first two months post exposure to air pollution, resulting in a 2.7% rise, for a 10 μg/m3 increase in PM2.5 concentration. These findings are robust and survive the inclusion of a host of explanatory variables to control for confounding factors.
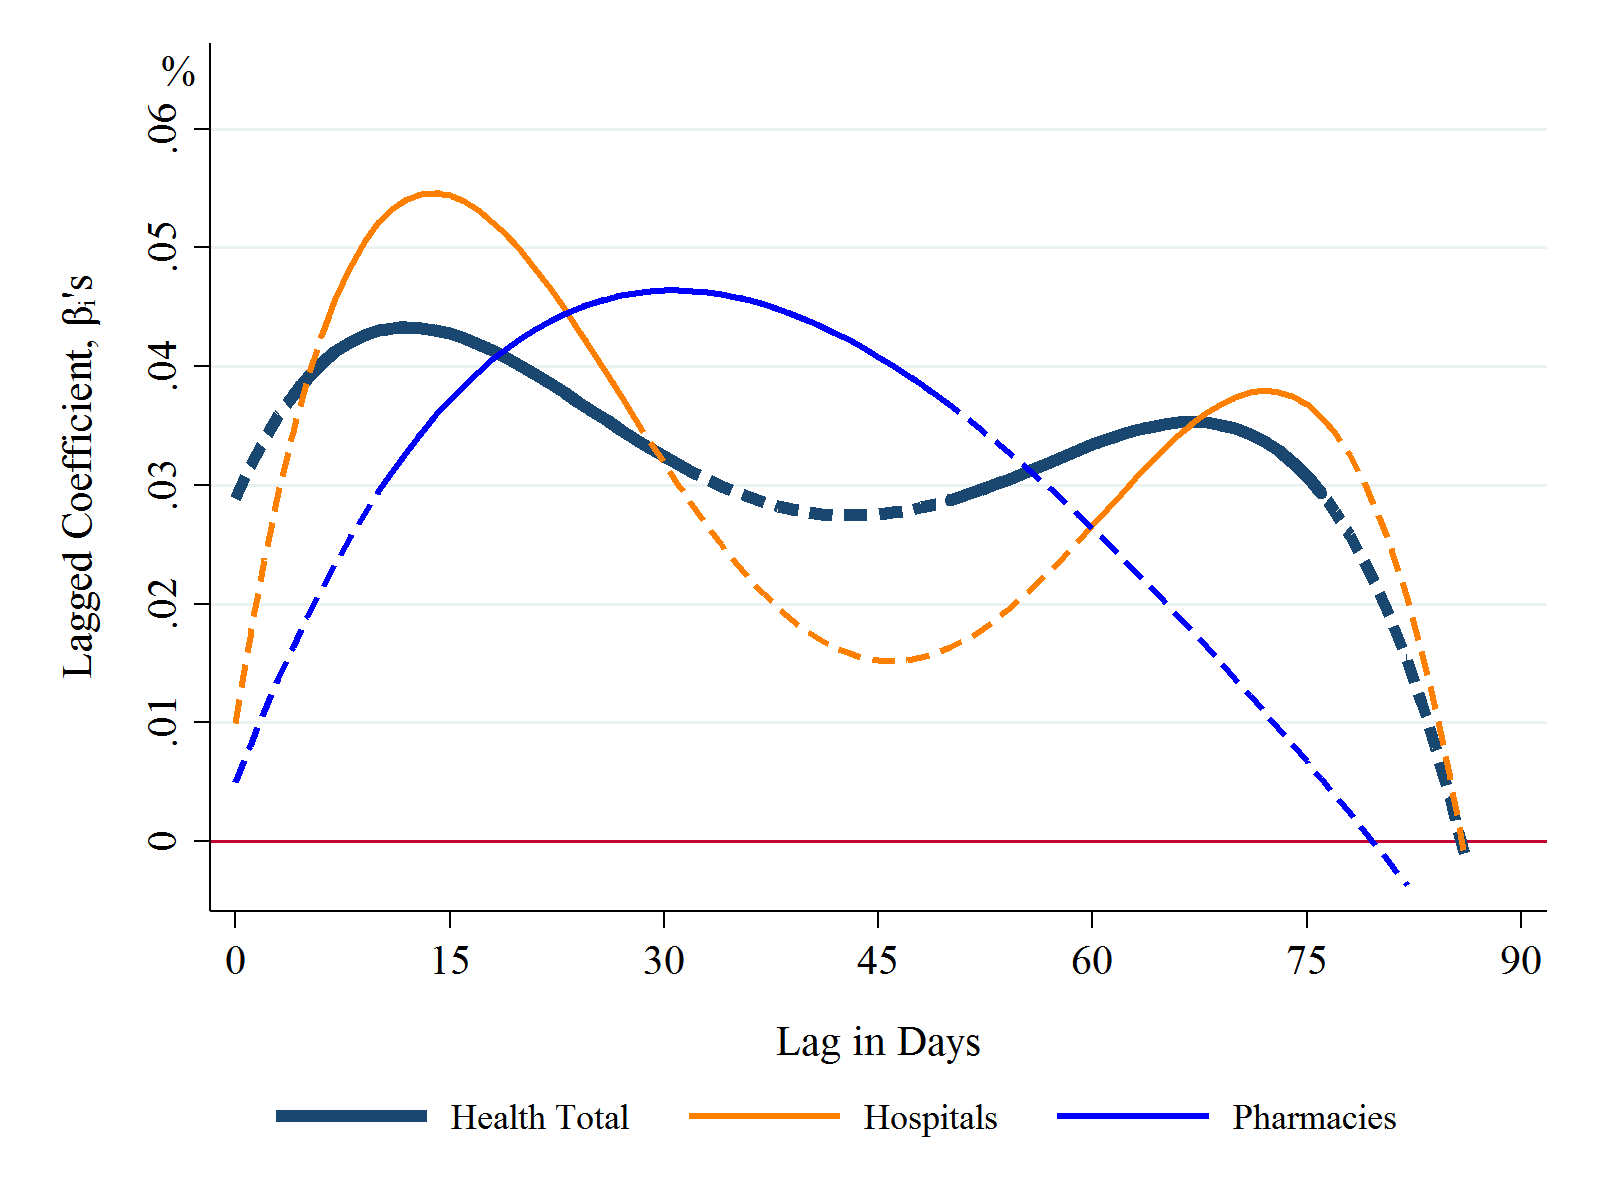
Only 10% of the higher spending occurs in the first week after exposure, while the majority of spending hikes materialize over the course of two to three months. This is consistent with the fact that the health impact of pollution is persistent. Particularly worrisome is that spending in children’s hospitals is two to three times more sensitive to pollution than that of other health categories – children are among the most vulnerable to air pollution.
Pollution is extremely costly: Given the sheer size of national health care expenditures, a 10 μg/m3 increase in PM2.5 concentration leads to a 75 billion yuan ($11 billion) increase in annual health spending. The estimated impact of PM2.5 on direct health cost suggests that households in China on average should be willing to pay at least 160 yuan per year per household for a reduction of PM2.5 concentration by 10 μg/m3, or 20% of the current level. This estimated impact and consumer willingness to pay does not include the cost associated with loss in productivity, reduced quality of life, and increased mortality, but only provides the lower bound for the true quantities.
The Chinese central government spent five billion and ten billion yuan in 2013 and 2014, respectively, on reducing air pollution. The National Plan on Air Pollution Control, developed for the first time as a national policy by the State Council in 2013, sets a goal of reducing PM2.5 by 25%, 20%, and 15% in 2017 relative to the 2012 levels in Beijing-Tianjin-Hebei, the Yangtze River Delta, and the Pearl River Delta regions, respectively. These regions account for 5% of land area but 23% of population and 40% of national output. Our findings suggest that these targeted reductions would generate significant health spending savings and substantial economic benefits.
(Shanjun Li, Dyson School of Applied Economics and Management, Cornell University; Panle Jia Barwick, Department of Economics, Cornell University; Deyu Rao, Department of Economics, Cornell University; Nahim Bin Zahur, Department of Economics, Cornell University.)
Brunekreef, B., & Holgate, S. T. (2002). Air Pollution and Health. The Lancet, 360(9341), 1233-1242. http://www.sciencedirect.com/science/article/pii/S0140673602112748
Panle Jia Barwick, Shanjun Li, Deyu Rao, Nahim Bin Zahur (2017). Air Pollution, Health Spending and Willingness to Pay for Clean Air in China, Cornell University Working Paper. https://papers.ssrn.com/sol3/papers.cfm?abstract_id=2999068
Pope III, C. A., & Dockery, D. W. (2006). Health Effects of Fine Particulate Air Pollution: Lines That Connect. Journal of the Air & Waste Management Association, 56(6), 709-742. http://www.tandfonline.com/doi/abs/10.1080/10473289.2006.10464485
Dockery, D. W. (2009). Health Effects of Particulate Air Pollution. Annals of Epidemiology, 19(4), 257-263. http://www.sciencedirect.com/science/article/pii/S1047279709000337

Latest
Most Popular
- VoxChina Covid-19 Forum (Second Edition): China’s Post-Lockdown Economic Recovery VoxChina, Apr 18, 2020
- China’s Great Housing Boom Kaiji Chen, Yi Wen, Oct 11, 2017
- China’s Joint Venture Policy and the International Transfer of Technology Kun Jiang, Wolfgang Keller, Larry D. Qiu, William Ridley, Feb 06, 2019
- The Dark Side of the Chinese Fiscal Stimulus: Evidence from Local Government Debt Yi Huang, Marco Pagano, Ugo Panizza, Jun 28, 2017
- Wealth Redistribution in the Chinese Stock Market: the Role of Bubbles and Crashes Li An, Jiangze Bian, Dong Lou, Donghui Shi, Jul 01, 2020
- Evaluating Risk across Chinese Housing Markets Yongheng Deng, Joseph Gyourko, Jing Wu, Aug 02, 2017
- What Is Special about China’s Housing Boom? Edward L. Glaeser, Wei Huang, Yueran Ma, Andrei Shleifer, Jun 20, 2017
- Privatization and Productivity in China Yuyu Chen, Mitsuru Igami, Masayuki Sawada, Mo Xiao, Jan 31, 2018
- Daily Price Limits and the Magnet Effect Ting Chen, Zhenyu Gao, Jibao He, Wenxi Jiang, Wei Xiong, Oct 25, 2017
- How did China Move Up the Global Value Chains? Hiau Looi Kee, Heiwai Tang, Aug 30, 2017


