A Bridge on Economic Issues between China and the World


 Facebook
  Twitter
  Instagram
 WeChat
  Email
Email Opening Up in the 21st Century: A Quantitative Accounting of Chinese Export Growth
China’s rapid export growth has spurred extensive research investigating its effects on other economies. However, the exact causes of the boom as well as the slowdown in Chinese exporting after 2007 are less well understood. In our forthcoming paper in the Journal of International Economics (Brandt and Lim, forthcoming), we quantify the drivers of Chinese export growth using a general equilibrium model estimated with detailed trade and production data that capture rich heterogeneity across destinations, firm ownership types, sectors, and production locations. The three key drivers of Chinese export growth overall are rising foreign demand, improvements in access to imported intermediates, and factor productivity growth within China. Weakening foreign demand and curtailment of further improvements in imported input access largely explain the slowdown in exporting after 2007. Furthermore, important differences across sectors, firm ownership types, and destinations caution against any single narrative.
Patterns of Chinese exports

We first document how patterns of Chinese exporting changed between 2000 and 2013. Utilizing transaction-level data on Chinese imports and exports collected by the Customs Administration of China and country-level import data from UN Comtrade, we examine four key margins: (i) the destination market for exports, (ii) the ownership of exporting firms, (iii) the sector of goods being exported, and (iv) the location of export production in China. Five stylized facts about Chinese exporting motivate our structural framework and set the context for our counterfactual results.
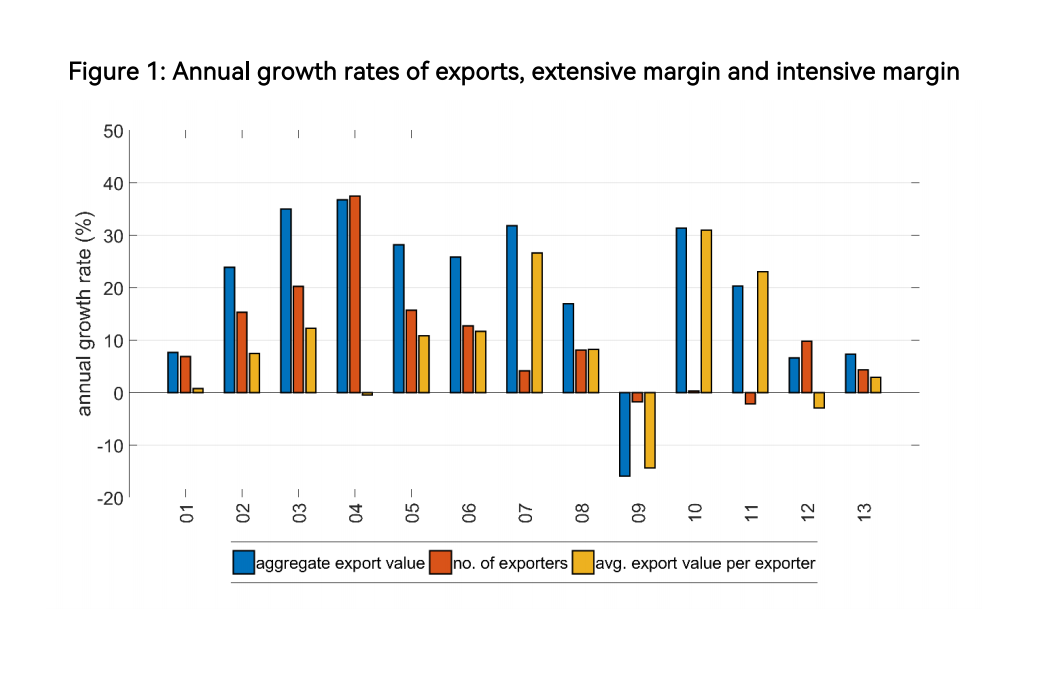
Fact 1: Aggregate dynamics. The aggregate value of Chinese exports grew quickly from 2000 to 2007, a product of high growth in both the number of exporting firms and the average value of exports per exporter (Figure 1). Export growth declined after 2007, accompanied by a sharp fall in the growth of the number of exporters.
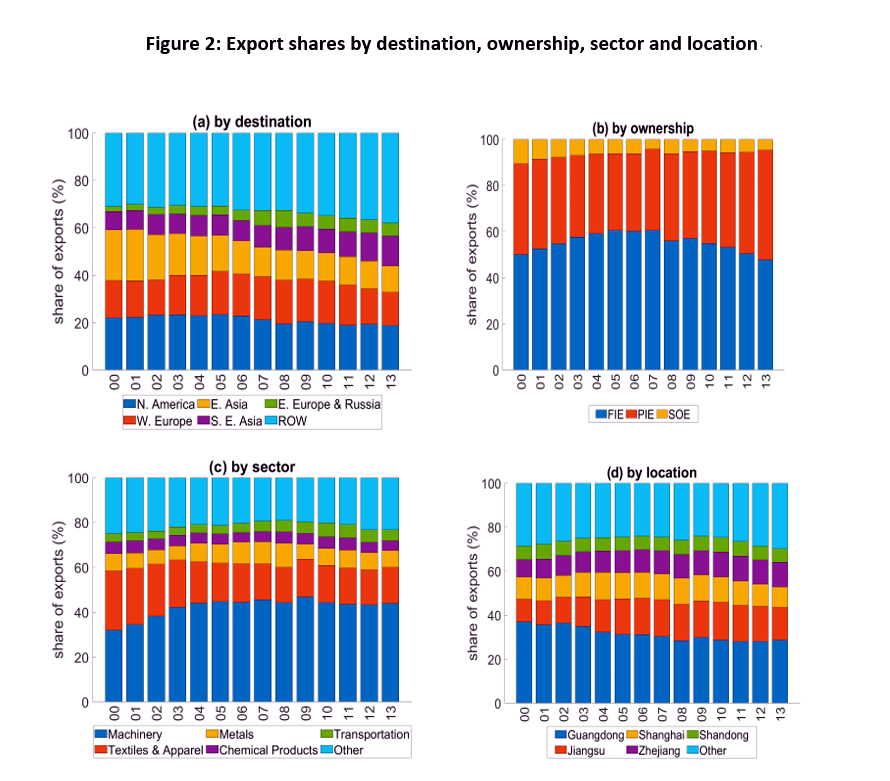
Fact 2: Exports by destination. Most of China’s exports were destined for markets in developed countries in North America, Western Europe, and East Asia. However, there was a marked shift to markets in lower and middle-income countries over time, especially Southeast Asia, Eastern Europe and Africa. Panel (a) of Figure 2 shows the shares of Chinese exports by geographic region. In 2000, 58.6% of Chinese exports were sold in North America, Western Europe, and East Asia, but by 2013 this share declined to 43.9%.
Fact 3: Exports by firm ownership. Foreign-invested enterprises (FIEs) were the source of most Chinese exports, followed by private-invested enterprises (PIEs), and state-owned enterprises (SOEs). The share of PIEs increased over time, initially at the expense of SOEs, and subsequently and more importantly, FIEs. The share of exports of SOEs fell throughout most of the period. Export propensities were significantly higher for FIEs but declined over time, as did those for PIEs. In contrast, they remained constant for SOEs. Panel (b) of Figure 2 provides a breakdown of Chinese exports by ownership type: FIEs, PIEs, and SOEs.
Fact 4: Exports by sector. China’s exports largely comprised machinery (HS-2 codes 84-85) and textiles and apparel (HS-2 codes 50-67), which together represented more than 60% of exports. FIEs were dominant in machinery, while Chinese firms were dominant in textiles and apparel. Over time, there was a shift away from textiles and apparel toward machinery. Panel (c) of Figure 2 shows the composition of Chinese exports by sector. The share of machinery rose from 32.2% in 2000 to 44.1% in 2013, accompanied by a fall in textiles over the same period from 26.5 to 16.1%.
Fact 5: Exports by production location. Production of Chinese exports was highly concentrated in coastal provinces, especially in Guangdong. Panel (d) of Figure 2 shows the share of Chinese exports produced in different locations within China. Exporting was consistently dominated by Guangdong, followed by Jiangsu, Shanghai, Zhejiang, and Shandong. However, their shares fell slightly after 2010 as a larger share of exports came from inland provinces. There was also substantial heterogeneity in the geographic distribution of export production for exports to different destinations, by firms of different ownership types, and in different sectors.
Modeling and counterfactual simulations
To explain these patterns, we develop a structural model of Chinese trade and production. As summarized by Autor et al. (2019), the literature examining China’s export surge has largely considered individual factors in isolation. Our approach contributes to the literature by building a framework that simultaneously captures multiple drivers of Chinese export growth—internal as well as external—in a general equilibrium setting. External drivers comprise changes in foreign demand, competition from the rest of the world, and costs of accessing foreign markets, while internal drivers consist of changes in factor-augmenting productivities, access to imported inputs, new firm entry, investment efficiency, labor market factors, and consumer consumption and savings behavior. The structure of the model enables us to map each of these potential drivers of export growth to a corresponding set of structural parameters that we estimate using the Chinese data.
Three steps in our estimation procedure are particularly important. First, we decompose Chinese exports into foreign market demand shifters and marginal production costs by assuming that the former vary by destination-sector while the latter vary by ownership-sector-location. Second, we use our estimates of marginal costs and information on input prices and expenditures to estimate production functions in China, following the approach in Doraszelski and Jaumandreu (2018). This yields, among other things, estimates of factor-augmenting productivities. Third, we calibrate export market competition, export market access costs, imported input prices, investment efficiency, and labor market factors to match Chinese export market shares, export propensities, imported input shares, capital prices, and wages respectively. With estimates of the model’s parameters in hand, we then formally quantify the drivers of Chinese export growth by using the model to predict what export growth rates would have been in the absence of each driver of growth.
Aggregate export results
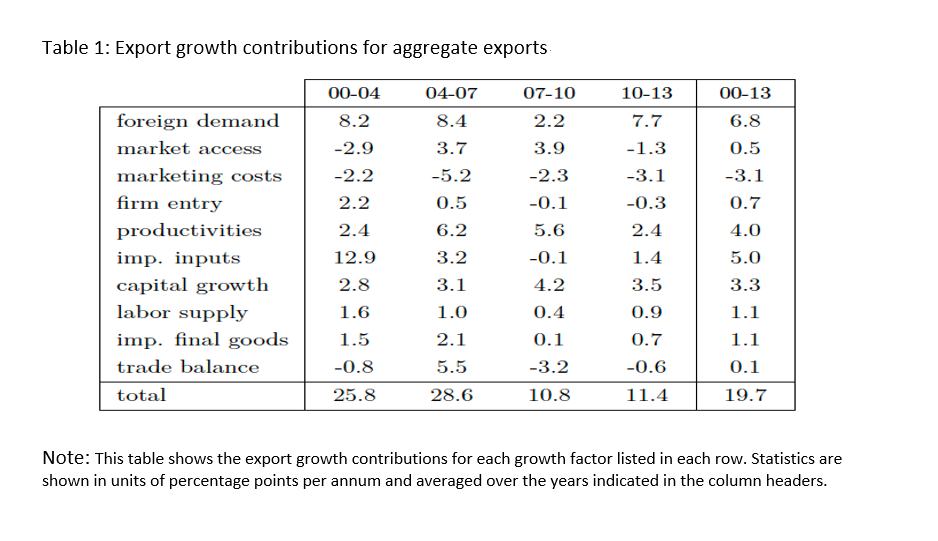
Our findings on the drivers of aggregate Chinese export growth are summarized in Table 1, which shows export growth contributions from each driver in units of percentage points per annum (ppa), averaged across years in four windows (2000–2004, 2004–2007, 2007–2010, and 2010–2013) as well as over the entire sample period. We highlight several important observations.
First, over the full sample period, the primary drivers of export growth are growth in foreign demand (6.8 ppa in the average year), better access to imported intermediates (5.0 ppa), and improvements in factor productivities (4.0 ppa), complemented by smaller contributions from capital growth (3.3 ppa).
Second, the growth rate of aggregate exports falls sharply from almost 30 ppa before 2007 to just over 10 ppa after 2007. The main reasons for this sharp decline are a lack of further improvements in access to imported intermediates (with export growth contributions of 8.8 ppa on average before 2007, but only 0.7 ppa after 2007), weakening external market demand (8.3 ppa versus 5.0 ppa), and a deterioration of China’s trade surplus to GDP ratio (1.9 ppa versus -1.9 ppa). The contributions from factor productivity growth also peak around 2007 and decline thereafter, while firm entry contributes negatively overall after 2007.
Finally, we observe important differences in the sources of export growth over time: (i) high growth from 2000 to 2004, driven primarily by foreign demand and imported input access; (ii) sustained growth from 2004 to 2007, driven mainly by foreign demand and factor productivity growth in China; (iii) a marked slowdown in growth from 2007 to 2010, owing largely to a decline in foreign demand and a deteriorating trade balance; and (iv) stagnant growth from 2010 to 2013, due mainly to the dissipation of internal factors such as productivity growth that offset the recovery of foreign demand.
Disaggregated export results
We also examine the drivers of export growth across different destinations, firm ownership types, and sectors. Here, we highlight several important patterns.
Export growth by destination
Before 2007, the three key drivers of aggregate export growth—greater foreign demand, improvements in imported input access, and factor productivity growth—are central to the growth in exports to each destination individually. After 2007, heterogeneity emerges in contributions arising from foreign demand. These contributions fall sharply for Western Europe (from 8.7 ppa before 2007 to -1.6 ppa after 2007) and Eastern Europe (from 33.4 to -11.1 ppa). In contrast, foreign demand begins to contribute positively for export growth to East Asia (5.6 ppa) and remains a robust source of growth for exports to Southeast Asia as well (9.1 ppa).
Export growth by firm ownership type
The decline in the contributions from foreign demand after 2007 primarily affects FIE exports (falling from 9.8 ppa to 0.6 ppa). This partly reflects the fact that FIEs exported more to markets with declining demand during this period (North America and Western Europe), in contrast to PIEs and SOEs that exported relatively more to markets where foreign demand remained robust (e.g., Southeast Asia).
Capital growth factors contributed similarly to FIE and PIE export growth before 2007 (3.3 ppa and 5.1 ppa, respectively), but these contributions diverged sharply after 2007, with large positive contributions for PIE exports (11.3 ppa) and negative contributions for FIE exports (-0.9 ppa). This divergence may in part reflect government policies after 2007 that aimed to improve access to capital for PIEs.
Firm entry exhibits positive contributions to export growth mainly for FIEs before 2007 (4.4 ppa), reflecting the high rates at which FIEs entered China during this period. In contrast, firm entry contributes little toward PIE and SOE export growth, and disappears as a source of growth for FIE exports after 2007.
Export growth by sector
We observe more symmetry in the sources of export growth across sectors before 2007. During this period, stronger foreign demand, improvements in imported input access, and growth in factor productivities were the main drivers of export growth in most sectors.
After 2007, the positive contributions from imported input access and foreign demand also largely disappeared in most sectors. However, the effects of weakening foreign demand are noticeably heterogeneous across sectors, with much sharper declines in metals, chemical products, and machinery and a more modest decline in textiles and apparel. In addition, the contribution of improvements in factor productivities to export growth varied substantially across sectors after 2007, with large positive contributions in textiles and apparel and transportation, smaller positive contributions in machinery, metals, and sectors outside the top five, and negative contributions in chemical products.
Looking forward
We document substantial changes in the dynamics of Chinese exports and their composition between 2000 and 2013. There are indications that the downward trends we have identified in the drivers of Chinese export growth persist through 2019 as export growth fell to only 2% per annum between 2013 and 2019.
There are alternative explanations for these trends. One possibility is that the slowdown after 2007 reflects the exhaustion of one-time gains garnered from a series of internal and external reforms to the Chinese economy. A slowdown in global growth would have further compounded these difficulties. We find however significant productivity gaps between FIEs and Chinese firms even at the end of our sample, which suggests the persistence of even larger productivity gaps between China and advanced countries and thus room for continued productivity growth for Chinese firms.
Chinese economic policy may also be salient here. Beginning in the mid-2000s, we observe a marked shift in Chinese development strategy as policy became more centralized and top-down, with a renewed focus on import substitution, indigenous innovation, and the building of national champions, often SOEs, in strategic and emerging industries. This shift was reinforced by policy during the Global Financial Crisis and strengthened under the leadership of Xi Jinping through such efforts as Made in China 2025 and the Belt and Road Initiative. Sorting out these alternative explanations seems essential to explaining China’s current macroeconomic trajectory, as well as its influences on the rest of the world. Data availability for later years will help make such analysis possible.
Finally, our analysis has potentially important implications for the welfare effects of the China shock in other countries. In the literature, China’s rapid export growth between 1992-2007 is viewed largely as the product of productivity gains tied to the country’s market opening (Autor et al. (2021)). However, we find significant differences in the drivers of export growth across sectors, ownership types, destinations, and over time. Furthermore, changes in welfare in other countries are likely to depend on exactly which growth factor explains observed levels of Chinese export growth. For example, a China shock driven by greater demand for Chinese products is likely to have very different welfare effects compared with a shock arising from Chinese factor productivity growth. Extending our analysis in this paper to consider these welfare implications is likely to yield important insights.
References
Autor, David, David Dorn, Gordon Hanson, and Lei Li. 2019. “Understanding Regional Export Growth in China.” In World Trade Evolution: Growth, Productivity and Employment, edited by Lili Yan Ing and Miaojie Yu, 195–228. Oxford, UK: Routledge.
Autor, David, David Dorn, and Gordon Hanson. 2021. “On the Persistence of the China Shock.” Harvard Kennedy School Working Paper No. RWP21-028. https://dx.doi.org/10.2139/ssrn.3973950.
Brandt, Loren, and Kevin Lim. “Opening Up in the 21st Century: A Quantitative Accounting of Chinese Export Growth.” Journal of International Economics (forthcoming).
Doraszelski, Ulrich, and Jordi Jaumandreu. 2018. “Measuring the Bias of Technological Change.” Journal of Political Economy 126 (3): 1027–84. https://doi.org/10.1086/697204.
Eaton, Jonathan, Samuel Kortum, Brent Neiman, and John Romalis. 2016. “Trade and the Global Recession.” American Economic Review 106 (11): 3401–38. https://doi.org/10.1257/aer.20101557.

Latest
Most Popular
- VoxChina Covid-19 Forum (Second Edition): China’s Post-Lockdown Economic Recovery VoxChina, Apr 18, 2020
- China’s Great Housing Boom Kaiji Chen, Yi Wen, Oct 11, 2017
- China’s Joint Venture Policy and the International Transfer of Technology Kun Jiang, Wolfgang Keller, Larry D. Qiu, William Ridley, Feb 06, 2019
- The Dark Side of the Chinese Fiscal Stimulus: Evidence from Local Government Debt Yi Huang, Marco Pagano, Ugo Panizza, Jun 28, 2017
- Wealth Redistribution in the Chinese Stock Market: the Role of Bubbles and Crashes Li An, Jiangze Bian, Dong Lou, Donghui Shi, Jul 01, 2020
- Evaluating Risk across Chinese Housing Markets Yongheng Deng, Joseph Gyourko, Jing Wu, Aug 02, 2017
- What Is Special about China’s Housing Boom? Edward L. Glaeser, Wei Huang, Yueran Ma, Andrei Shleifer, Jun 20, 2017
- Privatization and Productivity in China Yuyu Chen, Mitsuru Igami, Masayuki Sawada, Mo Xiao, Jan 31, 2018
- Daily Price Limits and the Magnet Effect Ting Chen, Zhenyu Gao, Jibao He, Wenxi Jiang, Wei Xiong, Oct 25, 2017
- How did China Move Up the Global Value Chains? Hiau Looi Kee, Heiwai Tang, Aug 30, 2017


