A Bridge on Economic Issues between China and the World


 Facebook
  Twitter
  Instagram
 WeChat
  Email
Email A Tale of Tier 3 Cities
This paper provides new estimates of the housing stock, construction rates, and price developments by city tier in China. We argue that China overall faces imbalances between supply and demand for housing stock, but the problem is significantly deeper in the generally smaller and lower-income tier 3 cities, which nevertheless account for more than 60% of both China’s GDP and roughly 50% of the value of its housing stock. Regression analysis across 298 cities (including 263 tier 3 cities) for the years 2000–2021 suggests that, controlling for population, urbanization rate, and GDP growth, real estate construction has been associated with higher local government debt and, since 2018, no longer contributes to growth in tier 3 cities.

Although a number of important papers on Chinese real estate have been published over the past decade (e.g., Fang et al. 2015 and Glaeser et al. 2017), the fast-paced development of the Chinese economy calls for frequent reassessment. In Rogoff and Yang (2020), we argued that after years of being the lynchpin of the Chinese growth model—accounting for roughly 23% of GDP including direct and indirect demand, 26% including imported content—China’s real estate industry might be running into diminishing returns. After all, even allowing for quality differences, the fact that per capita housing investment in China was already rivaling much wealthier European countries, and that the size of China’s real estate sector (relative to GDP) equaled that of Spain and Ireland just before their financial crises suggested that a rebalancing of the economy was inevitable. Skeptics, however, could point to the fact that real estate prices had continued to rise in large marquee tier 1 cities (e.g., Shanghai, Beijing, Guangzhou, and Shenzhen), which have been perhaps the greatest focus of study and attention. In the context of strong real estate prices, the recent problems of large property developers (most famously Evergrande) seemed to have more to do with short-term policy tightening than problems of long-term sustainability.
In Rogoff and Yang (2022), we show that the apparent disconnect may be due to the fact that too much attention had been focused on the larger, more prosperous regions that include the four tier 1 cities and another 31 tier 2 cities, where the most detailed data is available. Yet in China, because the population is more widely dispersed than in many Western countries, the lower tier cities (which we refer to collectively as “tier 3”) account for over 60% of GDP and roughly 50% of the value of its housing stock. We put together a novel data set allowing us to measure cumulative construction of the tier 3 housing stock, and to compare across a broad range of measures, including projections of demand and time to completion of projects, for both residential and commercial real estate. Although the results are nuanced and vary across the almost 300 cities included in our data set, a broad theme is that imbalances in tier 3 cities may be much more problematic than in tier 1 cities, and to a lesser extent tier 2 cities. Given the scarcity of nationwide vacancy data, which would be difficult to interpret in the COVID-19 era regardless, it is not possible to reach any definitive conclusion about the location and the extent of any excess capacity. But the fact that the overall population in tier 3 cities has started to decline, and that housing prices in many tier 3 cities are falling (at least according to the index we construct) suggests that the real estate and infrastructure buildup did not necessarily result in an influx of good jobs, similar to the experiences of many other countries, including the United States.
To look more deeply at the question of whether real estate construction is running into diminishing returns, we used our disaggregated data set to conduct regression analysis across 298 cities (including 263 tier 3 cities) for the years 2000–2021. Our analysis suggests that, controlling for population, urbanization rate, and GDP growth, real estate construction— both commercial and residential—was positively associated with city economic growth until 2018; the effect becomes much weaker after, and is even negative for tier 3 cities. At the same time, our statistical analysis suggests that local real estate construction may have been a significant factor in the large buildup of local government debt.
Concretely, Figure 1 below, based on the year-by-year estimates of housing stock by city tier we construct in our paper using data from the National Bureau of Statistics of China (NBS), shows the outsize weight of tier 3 cities in construction. To obtain annual housing stock, we use historical per capita residential floor space and total population available in the census to establish housing stock in the base year, and add annual residential housing construction.
Figure 1. Total Housing Stock by City Tier (million square meters)
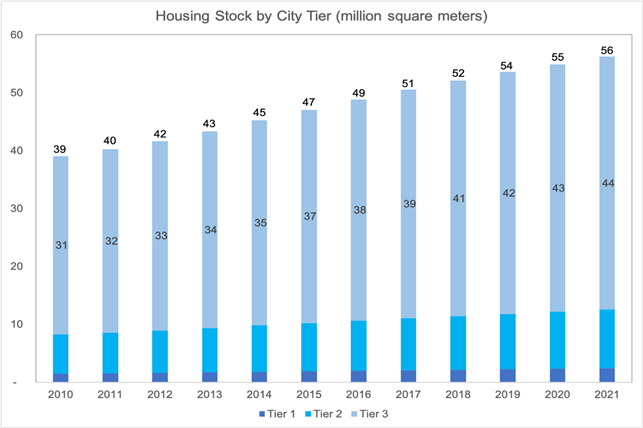
Sources: Official website of the National Bureau of Statistics of China, China Statistical Yearbook, 2010 Chinese National Census, 2020 Chinese National Census, 2010 Chinese Provincial Censuses.
Notes: The label in the center of the bar indicates the number for tier 3 cities. The label at above the bar indicates the total number.
We next turn to our estimates of recent tier 3 housing price developments, based on NBS data. Although China does not publish statistics on housing price developments for most tier 3 cities, it does publish price indices for tier 1 and tier 2 cities, as well as for a national average, calculated by dividing total national sales by total floor space sold. Making use of our calculations on the size of the housing stock in each grouping, we are able to infer price developments in tier 3 cities. As Figure 2 illustrates, recent prices have been much weaker in tier 3 cities, as compared to, say, tier 1 cities (Beijing, Shanghai, Shenzhen, and Guangzhou), which is consistent with our observations on demand and supply.
Figure 2. Housing Price Change by City Tier
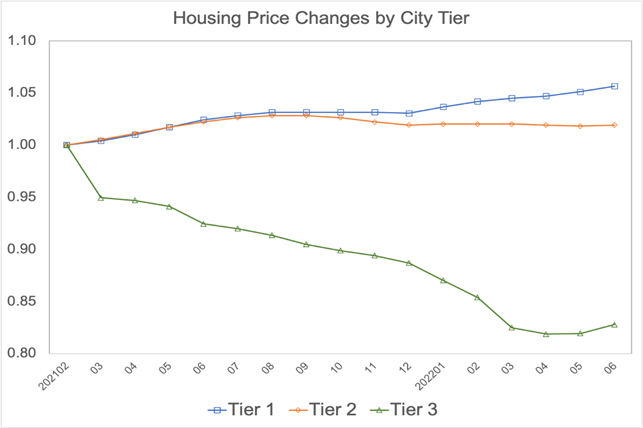
Source: Official website of the National Bureau of Statistics of China
Notes: The month of February 2021 is used as the base month and the indices measure cumulative change relative to the base month.
An aging population points to a declining housing demand in the foreseeable future nationally, but the problem is more acute for tier 3 cities, which are experiencing an acceleration in population outflows, as Figure 3 shows. Until now tier 3 cities have kept adding more homes despite already spacious per capita residential floor space. It is true that the real estate industry can shift away from construction of new homes and office buildings to instead upgrading and replacing existing structures. In fact, housing demand estimates based on the central UN population projection for China suggest that the demand for new urban housing will decline by about 3% annually through 2035, then replacement needs will account for 60% of construction. However, given that much of China’s urban real estate is relatively new, built after 2000, this will still require a considerable downward adjustment in industry size, with knock on effects to the economy. And again, a disproportionate share of adjustment may fall on cites outside the top two tiers.
Figure 3. Population Growth by City Tier
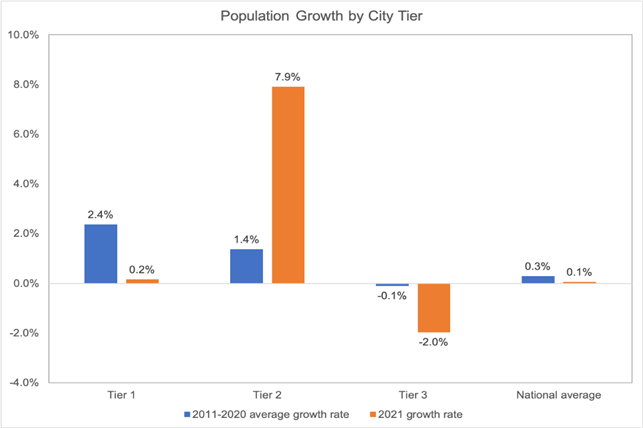
Source: Official website of National Bureau of Statistics of China.
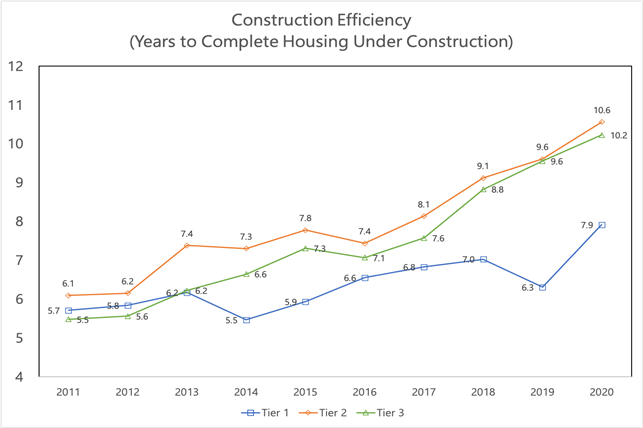
Finally, a key measure of distress is the number of unfinished construction projects. This measure has been expanding as demand shrinks, causing construction firms to have difficulty completing projects that are presold and offloading projects that are not. There have been a number of stories in the press about individual projects, but Figure 4 gives a concrete quantitative measure: the ratio of housing under construction over housing completed, which reflects the scale of uncompleted buildings relative to the existing building capacity. A typical real estate construction project, which took five to six years to be completed in the early 2010s, would take more than 10 years now and run the risk of being left unfinished. As the figure illustrates, the problem is acute not only in tier 3 cities, but also in tier 2 cities.
Figure 4. Housing Under Construction vs. Housing Completed by City Tier
There are parallel problems with commercial real estate and infrastructure. For example, although we do not have the same access to disaggregated data on infrastructure as for real estate, we are able to derive estimates for a number of major subcategories. For example, cities outside the top two tiers account for 88% of roads built and 92% of new road construction; similar statistics hold for pipelines. China’s high-speed rail system continues construction at a rate that far exceeds passenger miles, with a particularly large share devoted to tier 3 cities.
Of course, there are many policies to mitigate the impact of the shrinking need for real estate. For example, China is investing massively in green energy, and in the long term this will be an important source of employment. China also needs to expand production of consumer goods for local consumption, as well as services including medical care. But as the experience of many other countries has shown, it can be difficult to retrain and repurpose the construction labor force into extremely different kinds of jobs.
Overall, the problem of diminishing returns in real estate construction is one that cannot be ignored indefinitely. It is true that the Chinese government has enormous leverage over real estate through financial regulation and myriad other instruments, but this does not mean that the current malaise is simply due to excessive tightening of lending regulations. Decreasing returns are setting in for Chinese real estate just as they did for Russian railways and steel plants in the 1970s, and for Japanese infrastructure in the 1980s. How China succeeds in pivoting from real estate to other growth sectors will be an important determinant of its growth in the coming decades.
References
Chen, Kaiji, and Wen Yi. 2017. “The Great Housing Boom of China.” American Economic Journal: Macroeconomics 9 (2): 73–114. https://doi.org/10.1257/mac.20140234.
Fang, Hanming, Quanlin Gu, Wei Xiong, and Li-An Zhou. 2015. “Demystifying the Chinese Housing Boom.” NBER Macroeconomics Annual 30: 105–66. https://doi.org/10.1086/685953.
Gabaix, Xavier, 1999. “Zipf’s Law for Cities: An Explanation.” Quarterly Journal of Economics 114 (3): 739–67. https://www.jstor.org/stable/2586883.
Glaeser, Edward, Wei Huang, Yueran Ma, Andrei Shleifer. 2017. “A Real Estate Boom with Chinese Characteristics.” Journal of Economic Perspectives 31(1): 93–116. https://doi.org/10.1257/jep.31.1.93.
Liu, Chang, and Wei Xiong. 2018. “China’s Real Estate Market.” NBER Working Paper No. 25297. https://doi.org/10.3386/w25297.
Qiao, Wenzhi, Le Li, Weihua Guan, Xin Wang, and Xiaoge Wang. 2018. “Prediction of Urbanization Level in China: 2016–2050.” Economic Geography 2: 53–60.
Rogoff, Kenneth S., and Yuanchen Yang. 2020. “Peak China Housing.” NBER Working Paper No. 27697. https://doi.org/10.3386/w27697.
Rogoff, Kenneth S., and Yuanchen Yang. 2021. “The Size of China’s Real Estate Sector.” https://scholar.harvard.edu/files/rogoff/files/the_size_of_chinas_real_estate_sector.pdf
Rogoff, Kenneth S., and Yuanchen Yang. 2022. “A Tale of Tier 3 Cities.” NBER Working Paper No. 30519. https://doi.org/10.3386/w30519.

Latest
Most Popular
- VoxChina Covid-19 Forum (Second Edition): China’s Post-Lockdown Economic Recovery VoxChina, Apr 18, 2020
- China’s Great Housing Boom Kaiji Chen, Yi Wen, Oct 11, 2017
- China’s Joint Venture Policy and the International Transfer of Technology Kun Jiang, Wolfgang Keller, Larry D. Qiu, William Ridley, Feb 06, 2019
- The Dark Side of the Chinese Fiscal Stimulus: Evidence from Local Government Debt Yi Huang, Marco Pagano, Ugo Panizza, Jun 28, 2017
- Wealth Redistribution in the Chinese Stock Market: the Role of Bubbles and Crashes Li An, Jiangze Bian, Dong Lou, Donghui Shi, Jul 01, 2020
- Evaluating Risk across Chinese Housing Markets Yongheng Deng, Joseph Gyourko, Jing Wu, Aug 02, 2017
- What Is Special about China’s Housing Boom? Edward L. Glaeser, Wei Huang, Yueran Ma, Andrei Shleifer, Jun 20, 2017
- Privatization and Productivity in China Yuyu Chen, Mitsuru Igami, Masayuki Sawada, Mo Xiao, Jan 31, 2018
- Daily Price Limits and the Magnet Effect Ting Chen, Zhenyu Gao, Jibao He, Wenxi Jiang, Wei Xiong, Oct 25, 2017
- How did China Move Up the Global Value Chains? Hiau Looi Kee, Heiwai Tang, Aug 30, 2017


