A Bridge on Economic Issues between China and the World


 Facebook
  Twitter
  Instagram
 WeChat
  Email
Email “Golden Ages”: A Tale of the Labor Markets in China and the United States

We examine the Chinese growth experience in the last three decades through the lens of the labor market, focusing on evolving cross-sectional earnings distributions. We contrast the Chinese labor market with that of the United States and provide an interesting tale of the two labor markets over the last 30 years.

The rapid growth of the Chinese economy in the last 40 years is undoubtedly the most important economic event of our time. China’s GDP per capita (in 2010 constant US dollar) was USD 381 when it started its “Reform and Opening Up” in 1978, and it increased to USD 9,688 in 2018, which represents an astonishing twenty-five-fold increase in 40 years. The GDP per capita of the United States, the world’s leading economy, grew from USD 30,895 (also in 2010 constant US dollars) in 1978 to USD 59,822 in 2018, a slightly less than two-fold increase in the same time span (see Note 1). Numerous papers and books have been written about the Chinese economic growth miracle.
We examine the Chinese growth experience through the lens of the labor market, focusing on the evolving cross-sectional earnings distributions. This follows the long tradition in economics, as Smith (1776) noted in The Wealth of Nations that aggregate output would accrue to various original sources of production, one of which being labor; thus, the evolving earnings distribution in the Chinese labor market can provide a useful lens to examine the underlying sources of economic growth. We contrast the Chinese labor market with that of the United States and provide a tale of the two labor markets over the last 30 years.
We conduct a systematic comparison of the age-earnings profiles between the U.S. and China, the two largest economies in the world. The cross-sectional age-earnings profile is one of the most empirically examined objects in labor economics, dating back at least to Mincer (1974). A large and mature body of literature has confirmed the robust regularity of hump-shaped age-earnings profiles: earnings are low for young workers who have just entered the labor market, then rise with age, but level off at some point, and eventually decline after reaching the peak earnings age. We call the age group that achieves the highest average earnings in a cross-sectional age-earnings profile the “golden age.” We document three striking differences between the two labor markets during the last 30 years.
Fact 1: Age-specific (real) earnings were almost stagnant in the U.S. but grew drastically in China.
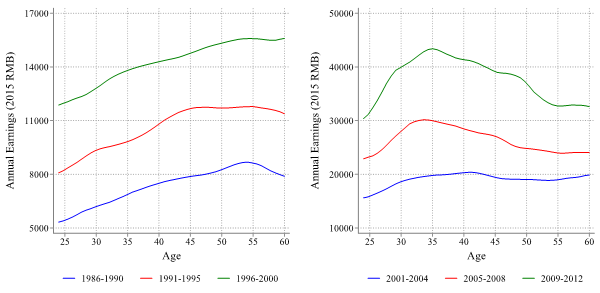
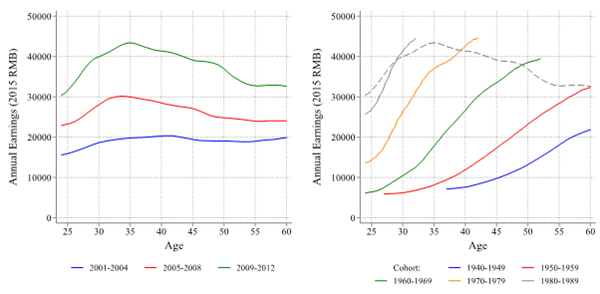
Figure 1 depicts the cross-sectional age-earnings profiles for male workers in the U.S. and China. Each curve represents a cross section that pools adjacent years. The U.S. has witnessed little growth in age-specific mean real earnings. Chinese workers, however, have experienced a dramatic increase in real earnings in the past 30 years for all age groups, reflected in the large vertical upward shifts of the age-earnings profiles for later cross sections. The earnings of Chinese urban male workers increased nearly sixfold, in marked contrast to the earnings stagnation in the U.S.
Figure 1: Evolution of Cross-Sectional Age-Earnings Profiles
(a) U.S.
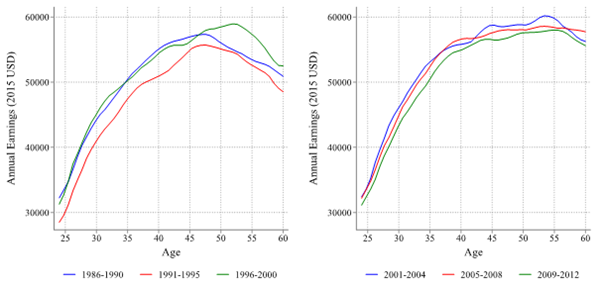
(b) China
Fact 2: The cross-sectional golden age stayed stable at around 45–50 years old in the U.S. but continuously decreased from 55 to 35 years old in China.
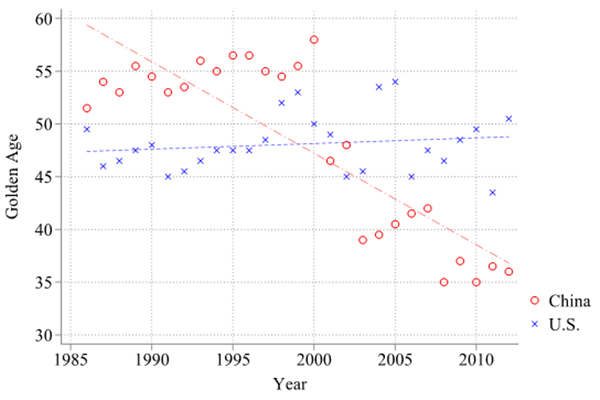
As seen in Figure 1, while the shape of the cross-sectional age-earnings profiles and hence the corresponding golden ages have stayed constant in the U.S., the golden age in China has continuously evolved to younger ages. Figure 2 further plots the evolution of the cross-sectional golden ages in the U.S. and China from 1986 through 2012. In the U.S., the golden age has remained constant at around 48 years old over the past 30 years, while in China there is a downward trend in the golden age during the same period, decreasing from more than 55 years old to around 35 years old.
Figure 2: Evolution of Cross-Sectional Golden Age in the U.S. and China
Fact 3: The cross-sectional and life-cycle age-earnings profiles look remarkably similar in the U.S. but differ substantially in China.
A cross-sectional age-earnings profile summarizes earnings of workers of different ages at a given time, while a life-cycle profile tracks the earnings of a given cohort over the life course. Figure 3 reproduces cross-sectional profiles from Figure 1 on the left and plots life-cycle earnings paths of various birth cohorts on the right. In the U.S., cohorts spanning half a century share remarkably similar life-cycle earnings paths. Furthermore, life-cycle profiles on the right closely resemble the cross-sectional profiles on the left, in both shapes and levels (see Note 2). However, the life-cycle patterns of different cohorts differ drastically for China. More recent cohorts enjoy both much higher earnings and steeper life-cycle earnings growth. These life-cycle profiles demonstrate no resemblance at all to the cross-sectional profiles, although they are simply different ways to visualize the same underlying data.
Figure 3: Cross-Sectional vs. Life-Cycle Age-Earnings Profiles
(a) U.S.
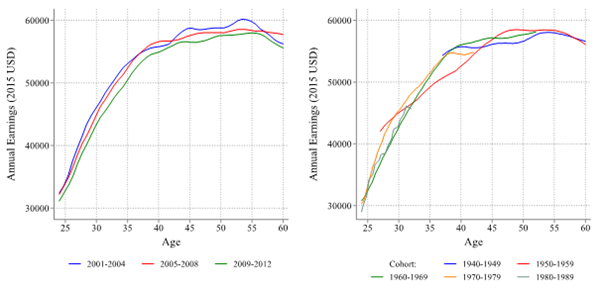
(b) China
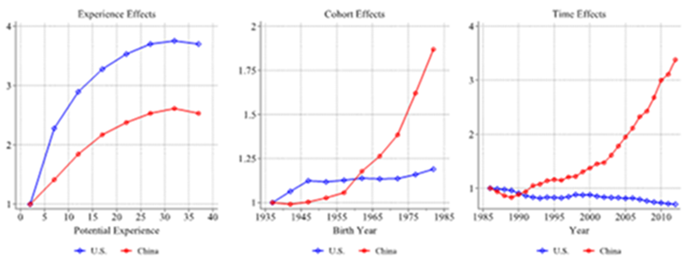
We then seek to uncover the causes of the differences between the two labor markets. We provide a framework to decompose the repeated cross-sectional age-earnings data into experience, cohort, and time effects, where experience effects capture human capital growth over the life cycle, cohort effects capture the inter-cohort human capital growth, and time effects capture the human capital rental price changes over time. They cannot be separately identified without further restrictions, due to perfect collinearity. However, under the identifying assumption that there is no growth in experience effect at the end of one’s working career, which is implied by the standard human capital investment theory (Ben-Porath 1967), we can infer these three components from the cross-sectional earnings data (see Note 3).
Figure 4 shows the decomposition of earnings into experience, cohort, and time effects. The main findings are:
(1) Experience effect: The human capital of Chinese workers increased by 150% over the life course of 40 years of working experience, while that of U.S. workers increased by 270%, nearly twice as high as that of Chinese workers.
(2) Cohort effect: In China, inter-cohort productivity growth was almost 90% in the last fifty years, most of which happened since the 1960 cohort; in contrast, there was only a 20% increase in the cohort-specific productivity over 50 years of cohorts in the U.S., most of which happened between cohort 1935 and 1950.
(3) Time effect: The human capital price increased more than threefold in China from 1986 to 2012; in contrast, the change of the human capital price was negligible in the U.S.
Figure 4: Decomposition
These inferred components allow us to account for the stylized facts regarding the differences in the evolution of the U.S. and China’s labor markets. Firstly, both the faster inter-cohort human capital growth and the faster human capital rental price increases in China contribute to its faster growth in age-specific earnings. Secondly (and relatedly), since both the cohort and time effects are negligible in the U.S., the experience effect is the major driver of both the cross-sectional and the life-cycle age-earnings profiles. As a result, they are both close to the experience effects and hence look similar. In China, however, both the cohort and time effects are substantial, so the life-cycle profiles are drastically different from the cross-sectional profiles. Thirdly, the golden age in a cross-sectional age-earnings profile is determined by the race between the experience and cohort effects. When the experience effect dominates, the golden age tends to be older; when the inter-cohort productivity growth prevails, the golden age tends to be younger. In China, inter-cohort productivity growth was rapid and won the race against the experience effect, which is why the golden age has declined to a younger age.
We also use the decomposition to revisit several important and classical applications in macroeconomics and labor economics. First, by isolating human capital price changes obtained from time effects, our decomposition delivers a notion of effective human capital quantities, which comprises both the experience and the cohort effects. Thus, it allows us to conduct a growth accounting that properly accounts for the evolution of the efficiency units of human capital, instead of simply the number of employed workers. Adjusting for changes in effective human capital, we obtain a series of total factor productivity growth estimates that are lower than the previous estimates. Second, we implement the decomposition separately for high school- and college-educated workers. We use the education-specific decompositions to obtain an estimated series for skill-biased technical change where the relative effective human capital quantities between college and high school workers are allowed to change over time.
Note 1: Statistics for China and U.S. are from https://fred.stlouisfed.org/series/NYGDPPCAPKDCHN and https://fred.stlouisfed.org/series/NYGDPPCAPKDUSA, respectively.
Note 2: This provides a justification for the voluminous prior literature that uses cross-sectional profiles as approximations of life-cycle patterns in the U.S. setting.
Note 3: This identification idea was exploited originally by Heckman et al. (1998), and more recently also by Huggett et al. (2011), Bowlus and Robinson (2012), and Lagakos et al. (2018). Lagakos et al. (2018) present a state-of-the-art treatment of the experience-cohort-time identification issue.
(Hanming Fang is Joseph M. Cohen professor of economics at the University of Pennsylvania, an Adjunct Professor at the ShanghaiTech University, and a research associate of the National Bureau of Economic Research; Xincheng Qiu is a Ph.D. student in the Department of Economics at the University of Pennsylvania.)
References
Ben-Porath, Yoram. 1967. “The Production of Human Capital and the Life Cycle of Earnings.” Journal of Political Economy 75, no. 4 (Part 1): 352–65. https://www.jstor.org/stable/1828596.
Bowlus, Audra J., and Chris Robinson. 2012. “Human Capital Prices, Productivity, and Growth.” American Economic Review 102 (7): 3483–515. https://doi.org/10.1257/aer.102.7.3483.
Fang, Hanming, and Xincheng Qiu. 2021. “‘Golden Ages’: A Tale of the Labor Markets in China and the United States.” NBER Working Paper No. 29523. https://www.nber.org/papers/w29523.
Heckman, James J., Lance Lochner, and Christopher Taber. 1998. “Explaining Rising Wage Inequality: Explorations with a Dynamic General Equilibrium Model of Labor Earnings with Heterogeneous Agents.” Review of Economic Dynamics 1 (1): 1–58. https://doi.org/10.1006/redy.1997.0008.
Huggett, Mark, Gustavo Ventura, and Amir Yaron. 2011. “Sources of Lifetime Inequality.” American Economic Review 101 (7): 2923–54. https://doi.org/10.1257/aer.101.7.2923.
Lagakos, David, Benjamin Moll, Tommaso Porzio, Nancy Qian, and Todd Schoellman. 2018. “Life Cycle Wage Growth across Countries.” Journal of Political Economy 126 (2), 797–849. https://doi.org/10.1086/696225.
Mincer, Jacob. 1974. Schooling, Experience, and Earnings. Cambridge, MA: National Bureau of Economic Research.
Smith, Adam. 1776. An Inquiry into the Nature and Causes of the Wealth of Nations. London: W. Strahan and T. Cadell.

Latest
Most Popular
- VoxChina Covid-19 Forum (Second Edition): China’s Post-Lockdown Economic Recovery VoxChina, Apr 18, 2020
- China’s Great Housing Boom Kaiji Chen, Yi Wen, Oct 11, 2017
- China’s Joint Venture Policy and the International Transfer of Technology Kun Jiang, Wolfgang Keller, Larry D. Qiu, William Ridley, Feb 06, 2019
- The Dark Side of the Chinese Fiscal Stimulus: Evidence from Local Government Debt Yi Huang, Marco Pagano, Ugo Panizza, Jun 28, 2017
- Wealth Redistribution in the Chinese Stock Market: the Role of Bubbles and Crashes Li An, Jiangze Bian, Dong Lou, Donghui Shi, Jul 01, 2020
- Evaluating Risk across Chinese Housing Markets Yongheng Deng, Joseph Gyourko, Jing Wu, Aug 02, 2017
- What Is Special about China’s Housing Boom? Edward L. Glaeser, Wei Huang, Yueran Ma, Andrei Shleifer, Jun 20, 2017
- Privatization and Productivity in China Yuyu Chen, Mitsuru Igami, Masayuki Sawada, Mo Xiao, Jan 31, 2018
- Daily Price Limits and the Magnet Effect Ting Chen, Zhenyu Gao, Jibao He, Wenxi Jiang, Wei Xiong, Oct 25, 2017
- How did China Move Up the Global Value Chains? Hiau Looi Kee, Heiwai Tang, Aug 30, 2017


