The Impact of the COVID-19 Pandemic on Consumption: Learning from High Frequency Transaction Data
Based on daily transaction data in 214 cities and the difference-in-differences method, we document that daily offline consumption fell by 32%, or 18.57 million RMB per city, during the twelve-week period after China’s COVID-19 outbreak in late January 2020. This implies that China’s offline consumption decreased by over 1.22 trillion RMB in the three-month post-outbreak period, or 1.2% of China’s 2019 GDP. Our estimates suggest a significant economic benefit of containing the virus through a lessened consumption decrease and a faster consumption recovery.

Countries around the globe have increasingly implemented strict public health measures to respond to the COVID-19 outbreak. Such measures are effective in containing the spread of the virus (Greenstone and Nigam 2020; Fang, Wang, and Yang 2020), but also create direct and indirect economic costs (Adda 2016; Chen, He, Hsieh, and Song 2020). A major economic woe is firms’ immediate cashflow pressure from the sudden halt in economic activities, leading to massive unemployment and business shutdown that feed back into aggregate demand. However, the huge uncertainty about projecting the course of the pandemic directly hurts consumers’ willingness to consume when they feel unsafe and anxious. Even with no imminent threat of economic security, a prolonged pandemic outbreak will weaken demand and delay economic recovery. Therefore, the mechanism through which the COVID-19 pandemic affects consumption deserves exploration.
In Chen, Qian, and Wen (2021), we provide direct evidence on the immediate economic impact of the COVID-19 outbreak, drawing upon China’s experience. We access the universe of consumer spending transactions at offline merchants using bank cards and QR codes (i.e., linked to e-wallets in Alipay and WeChat pay), captured by UnionPay’s POS machines and QR scanners. Raw data demonstrates that China’s consumption took a severe hit as a result of the outbreak: the average difference in total offline consumption for the 214 cities in sample is 8.06 billion RMB per day in 2020.
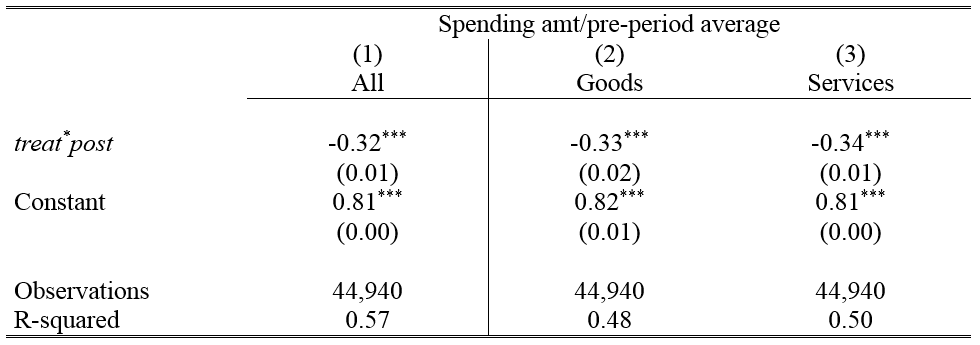
To isolate the impact of the COVID-19 outbreak on consumption from the seasonal variation in spending during the Chinese New Year period, we use difference-in-differences regression to estimate the change in consumption relative to the counterfactual change in spending based in 2019. The regression result suggests cities witnessed a 32% decline in their offline consumption (Table 1). This finding translates into a total decrease of 329.84 billion RMB in the twelve-week post-outbreak period. If other offline consumption experienced a similar rate of decrease, and using the fact that UnionPay captures 30% of China’s offline consumption and that our sample covers 90% of the urban population, we infer a total decrease in China’s offline consumption of 14.72 billion RMB per day, or 1.22 trillion RMB during the twelve-week post-outbreak period. As a reference, the country’s total GDP in 2019 was 99.1 trillion RMB, and China’s total retail sales of consumer goods decreased about 1.8 trillion RMB in the first quarter of 2020.
Table 1: The Impact of COVID-19 on Offline Consumption

Note: This table reports the regression results for the average impact of COVID-19 on offline consumption for all cities in the sample. The dependent variable is the spending amount divided by pre-period average spending of each city, and all daily consumption data are winsorized at the 1st and 99th percentile to remove the effect of outliers. The dummy variable treat is defined as 1 for observations in 2020, and 0 otherwise. post is defined as 1 for the post-event period and the event date 0 is January 23 for 2020 and February 3 for 2019. All regressions include the fixed effects for city, distance to Chinese New Year (CNY), day of week and treat-year. Standard errors reported in parentheses are clustered at the city level. *** p<0.01, ** p<0.05, * p<0.1.
One plausible hypothesis lies in the substitution from shopping offline to online as a result of COVID-19. We utilize the online spending data captured by the online payment platform ChinaPay (held by UnionPay) and compare the online spending response relative to that of offline spending in 2020. The difference-in-differences result suggests online spending also decreased, though much less than offline spending, by 13% (=0.31-0.44). If we extrapolate this estimate as representative, given the 76% share of offline consumption in China, we infer the total consumption in China experienced a decrease of 27% twelve weeks after the outbreak.
To further explore whether the pandemic can directly induce uncertainty and anxiety and change consumers’ willingness to spend, we leverage high frequency data to examine how daily consumption in each city responds to day-to-day changes in the severity of the outbreak in that city, while controlling for city and time fixed effects. The epidemic measures, including the number of COVID-19 cases, hospital capacity, and the COVID-19 death toll in the city, not only gauge the day-to-day change in severity, but also capture changing uncertainty about the length and trajectory of the city’s epidemic exposure. At the same time, we note that relevant distancing and mobility-restriction measures (Fang, Wang, and Yang 2020) as well as macroeconomic conditions varied at a much lower frequency in the sample period, allowing us to distinguish from the effect of distancing measures.
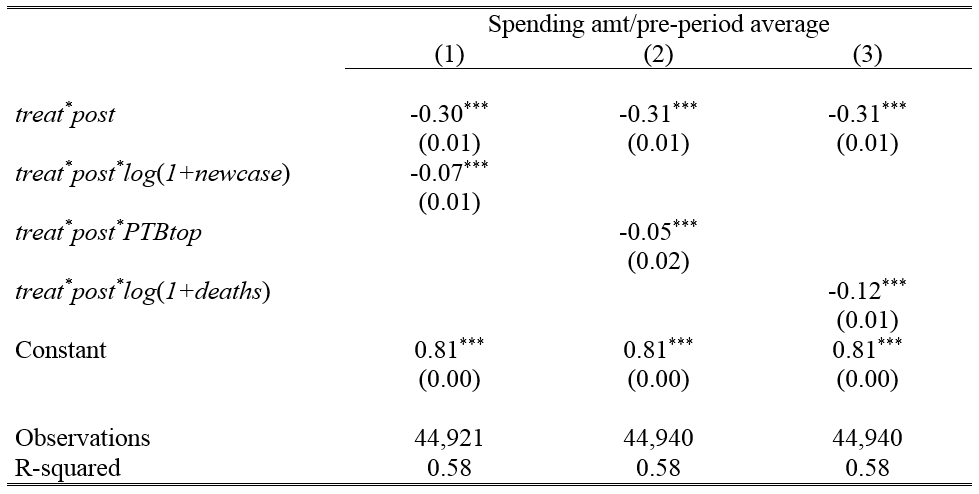
Results suggest a strong negative sensitivity of consumption to within-city changes in outbreak severity (Table 2). Doubling the infected cases in a city was followed by a 4.9% greater decrease in same-city offline consumption. In addition, rising numbers heightened the concern about hospital capacity: when a city was among the 30 cities with the highest COVID-19 cases relative to the city’s hospital bed capacity, city offline consumption dropped by an additional 5%. Similarly, doubling the city’s COVID-19 deaths led to an additional 8.3% decrease in consumption. These results suggest consumer demand responds promptly to uncertainty regarding the pandemic’s trajectory.
Table 2: The Impact on Offline Consumption: Within-City Intensity

Note: This table reports the regression results for the average impact of COVID-19 on offline consumption for all cities in the sample. The dependent variable is the spending amount divided by pre-period average spending of each city, and all daily consumption data are winsorized at the 1st and 99th percentile to remove the effect of outliers. The dummy variable treat is defined as 1 for observations in 2020, and 0 otherwise. post is defined as 1 for post-periods [0,82], and 0 otherwise, with the event date 0 defined as January 23, 2020 (the date when the Wuhan lockdown was implemented). newcase is the one-day lagged number of newly confirmed cases (excluding asymptomatic cases). PTBtop is defined as 1 if the city’s PTB is among the top 30 on this date, and 0 otherwise. deaths is the one-day lagged number of deaths. Fixed effects for city, treat-year, distance to Chinese New Year (CNY), and day of week are included. Standard errors reported in parentheses are clustered at the city level. *** p<0.01, ** p<0.05, * p<0.1.
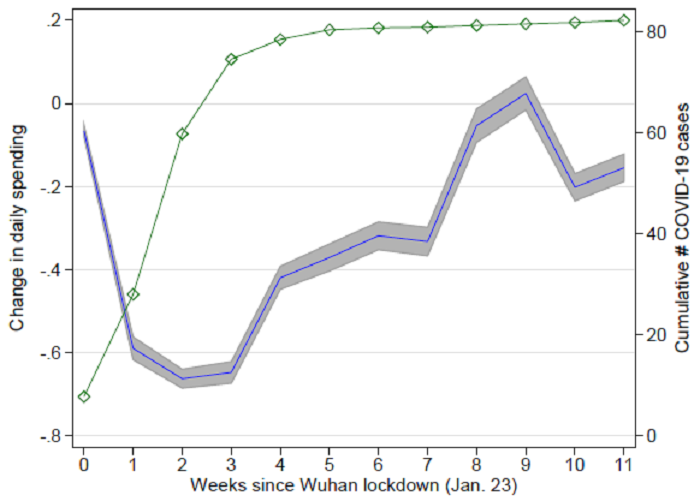
We also study the dynamic pattern of the offline consumption response to the COVID-19. Offline consumption experienced a strong recovery during our sample period, which also traced the epidemic development. As shown in Figure 1, the decline in consumption started immediately after Wuhan lockdown. Notably, the consumption change became less negative starting from the fifth week, when the epidemic curve shows sign of flattening. By the end of March (i.e., ten weeks after the outbreak), consumption had fully rebounded since the difference-in-differences estimate is not statistically distinguishable from zero. However, consumption fell again in the first two weeks of April. This retreat echoes the rising concern over a potential second wave of infections, mostly driven by imported and asymptomatic cases.
Figure 1: Dynamic Offline Consumption Response

Note: This figure presents the dynamic offline consumption response. Change in daily offline consumption is the regression coefficients estimated from the difference-in-differences regression on twelve dummy variables, post0, post1, …, post11, interacting with the treat dummy variable, and all daily consumption data are winsorized at the 1st and 99th percentile to remove the effect of outliers. The dummy variables post0 is defined for the sample period [0, 6] after the event date, whereas post1, …, post11 are defined for the subsequent eleven weeks after the event date. Treat is equal to 1 for observations in 2020, and 0 for observations in 2019. The event date is defined as January 23, 2020 (the date when Wuhan lockdown was implemented), whereas the event date for 2019 is defined as February 3, 2019, one day before the 2019 Chinese New Year’s Eve. The blue line displays the changes of daily offline consumption, with shaded area indicating 95% confidence intervals. Cumulative # of COVID-19 cases is the cumulative COVID-19 cases (excluding asymptomatic cases) at the end of the event week.
To further investigate why consumption declined in April, we relate the day-to-day consumption responses to the one-day lagged number of new cases, finding that they indeed have a strong negative relationship. Since most cities relaxed their mobility restrictions measures by April, this evidence highlights the importance of epidemic containment in driving economic recovery.
Our results highlight a unique feature associated with the current crisis in that the pandemic-induced uncertainty has a significant negative impact on the population’s willingness to consume. The findings thus emphasize the importance of policymakers using prompt and adequate interventions to alleviate the negative impact especially on the more affected sectors such as retail and certain service industries.
(Haiqiang Chen, Wang Yanan Institute for Studies in Economics, School of Economics, Xiamen University; Wenlan Qian, NUS Business School, National University of Singapore; Qiang Wen, Business School, Sichuan University.)
References
Adda, Jérôme. 2016. “Economic Activity and the Spread of Viral Diseases: Evidence from High Frequency Data.” Quarterly Journal of Economics 131 (2): 891–941. https://doi.org/10.1093/qje/qjw005.
Chen, Haiqiang, Wenlan Qian, and Qiang Wen. 2021. “The Impact of the COVID-19 Pandemic on Consumption: Learning from High Frequency Transaction Data.” AEA Papers and Proceedings, 111 (May), 307–11. https://doi.org/10.1257/pandp.20211003.
Chen, Qin, Zhiguo He, Chang-Tai Hsieh, and Zheng (Michael) Song. 2020. “Economic Effects of Lockdown in China.” Chinese University of Hong Kong-Tsinghua University Joint Research Center for Chinese Economy, COVID-19 Thematic Report No. 2. http://research-center.econ.cuhk.edu.hk/images/PAPERS/CCE_Report_COVID-19_Thematic_Report_No2.pdf.
Fang, Hanming, Long Wang, and Yang Yang. 2020. “Human Mobility Restrictions and the Spread of the Novel Coronavirus (2019-nCoV) in China.” Journal of Public Economics, 191 (November): 104272. https://doi.org/10.1257/pandp.20211003.
Greenstone, Michael, and Vishan Nigam. 2020. “Does Social Distancing Matter?” BFI Working Paper No. 2020-26. https://papers.ssrn.com/sol3/papers.cfm?abstract_id=3561244.

Latest
Most Popular
- VoxChina Covid-19 Forum (Second Edition): China’s Post-Lockdown Economic Recovery VoxChina, Apr 18, 2020
- China’s Great Housing Boom Kaiji Chen, Yi Wen, Oct 11, 2017
- China’s Joint Venture Policy and the International Transfer of Technology Kun Jiang, Wolfgang Keller, Larry D. Qiu, William Ridley, Feb 06, 2019
- The Dark Side of the Chinese Fiscal Stimulus: Evidence from Local Government Debt Yi Huang, Marco Pagano, Ugo Panizza, Jun 28, 2017
- Wealth Redistribution in the Chinese Stock Market: the Role of Bubbles and Crashes Li An, Jiangze Bian, Dong Lou, Donghui Shi, Jul 01, 2020
- What Is Special about China’s Housing Boom? Edward L. Glaeser, Wei Huang, Yueran Ma, Andrei Shleifer, Jun 20, 2017
- Evaluating Risk across Chinese Housing Markets Yongheng Deng, Joseph Gyourko, Jing Wu, Aug 02, 2017
- Privatization and Productivity in China Yuyu Chen, Mitsuru Igami, Masayuki Sawada, Mo Xiao, Jan 31, 2018
- How did China Move Up the Global Value Chains? Hiau Looi Kee, Heiwai Tang, Aug 30, 2017
- China’s Shadow Banking Sector: Wealth Management Products and Issuing Banks Viral V. Acharya, Jun Qian, Zhishu Yang, Aug 09, 2017


 Facebook
  Twitter
  Instagram
 WeChat
  Email
Email 


