A Bridge on Economic Issues between China and the World


 Facebook
  Twitter
  Instagram
 WeChat
  Email
Email Notching R&D Investment with Corporate Income Tax Cuts in China

To encourage innovation, the Chinese government gave tax incentives to firms whose R&D intensity (as measured by the ratio of R&D expenditures over total sales) exceeds a threshold that varies by their total sales. Using a major corporate tax reform in 2008, Professor Daniel Yi Xu from Duke University and his coauthors provide empirical evidence for some “strategic” behavior — including some relabeling of administrative expenditures as R&D — by the firms to take advantage of the tax incentives.
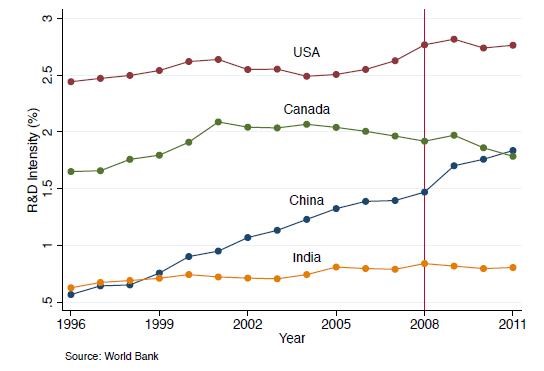
As China’s industrialization reaches a mature stage, the future development of the country depends on an economic transition towards innovative and technology-intensive industries. Figure 1 shows that this transition is already underway, as China has now equaled or surpassed developed-country levels of R&D intensity (Total R&D Expenditure/GDP). Indeed, the country’s leaders have focused their efforts on fostering this transition, which may help explain the explosive growth in R&D intensity.
In this article, we discuss the effects of one such effort that awards large corporate income tax cuts to firms with substantial R&D investment. As in other countries, the benefit of a tax incentive for R&D is that increased investment may spur productivity spillovers, but the policy comes at the cost of foregone tax revenues (Hall and Van Reenen, 2001). A particular concern is that reported R&D may not correspond to real investment, but may represent firms’ abilities to relabel non-R&D expenses (e.g., administrative salaries) in order to qualify for the tax incentive.In Chen et al. (2017), we assess the cost-effectiveness of the policy by analyzing how firms respond to the tax incentive, and how these responses affect firm-level productivity. We show that R&D investment responds very sharply to fiscal incentives, but that a non-negligible component of this response is due to the relabeling of non-R&D expenses, which increases the fiscal cost of incentivizing R&D investment. We find that the policy led to significant increases in firm-level productivity and profitability. Our results suggest that policies that increase real R&D investment while limiting the scope of relabeling will help the country transition to a more innovative economy and will reduce the fiscal cost of incentivizing R&D investment.
We analyze a fiscal incentive provided by the InnoCom program, which targets “high tech enterprises” (HTE) by awarding qualifying firms with a flat 15 percent income tax rate. This is a significant fiscal incentive since the average rate applies to a firm’s entire reported income, and since firms may otherwise face much higher tax rates. Specifically, from 2000-2007, domestic-owned enterprises faced a 33 percent rate, while the rate faced by foreign-owned enterprises ranged from 15 percent to 24 percent.
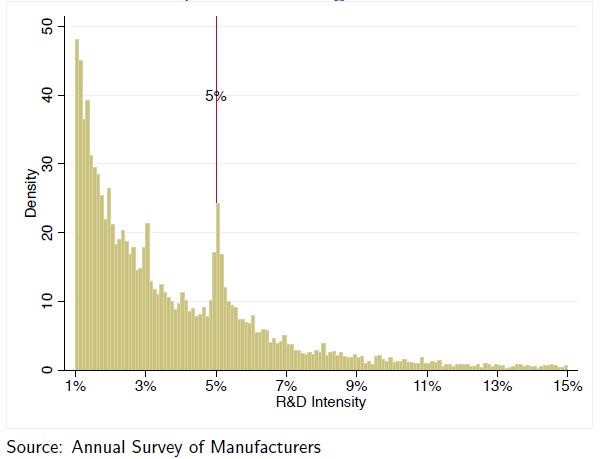
The program’s most important requirement is that a firm’s R&D intensity (ratio of R&D expenditure to total sales) must be greater than or equal to 5 percent. This requirement generates a “notch,” or jump, in firm values as the after-tax value of a given firm increases discontinuously when it benefits from the lower average tax rate. We would then expect to see a large fraction of firms responding to the incentive of the program by increasing their R&D intensity to a value above 5 percent.
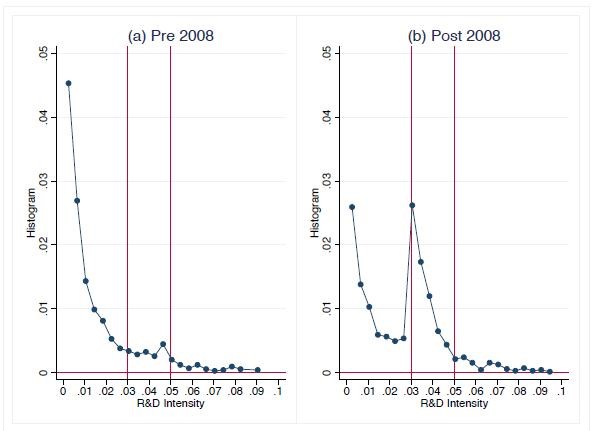
In addition to the sharp cross-sectional implications of the program, we obtain additional predictions from reforms that modified the requirements to participate in the InnoCom program, as well as the tax benefits enjoyed by qualifying firms. In 2008, the Chinese government implemented a major corporate tax reform that eliminated the dual-track system based on domestic/foreign ownership, and established a common rate of 25 percent. In concert with this reform, the Ministry of Science and Technology reformed the InnoCom program by streamlining the application process, improving compliance by teaming-up with the Ministry of Finance and the National Tax, and by changing the R&D intensity requirement to depend on firms’ sales.
The post-2008 requirements are as follows:
• Firms with sales below 50 million RMB must maintain an R&D intensity at or above 6 percent.
• Firms with sales above 50 million RMB but below 200 million RMB must maintain an R&D intensity at or above 4 percent.
• Firms with sales above 200 million RMB must maintain an R&D intensity at or above 3 percent.
These reforms generate sharp predictions for R&D investment, as firms with different characteristics will respond to the program by increasing their R&D intensity to different thresholds.
Descriptive Evidence of Bunching
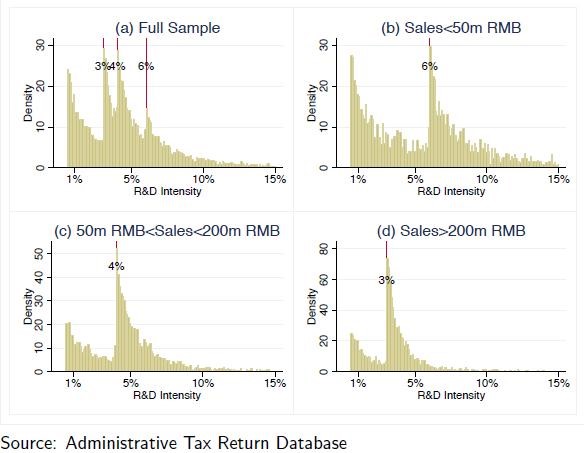
We find strong descriptive evidence suggesting that R&D investment by Chinese manufacturing firms is responsive to the fiscal incentives of the InnoCom program. Figure 2 plots the empirical distribution of the R&D intensity of Chinese firms in 2011 for the subsample of firms with non-trivial innovation activities. The first panel in Figure 2 shows the histogram of the overall R&D intensity distribution. There are clear bunching patterns at 3 percent, 4 percent, and 6 percent of R&D intensity, which correspond to the three thresholds where the corporate income tax cut is applied. To further validate that these R&D bunching patterns are motivated by this specific policy, the remaining panels of Figure 2 plot the histograms of R&D intensity for the three different sales groups as specified by the InnoCom program. In each of these panels, we only observe bunching at the R&D intensity threshold that corresponds to each size category. Figure 2 provides strong prima facie evidence that the fiscal incentives provided by the InnoCom program play an important role in firm’s R&D investment decisions.
R&D Relabeling
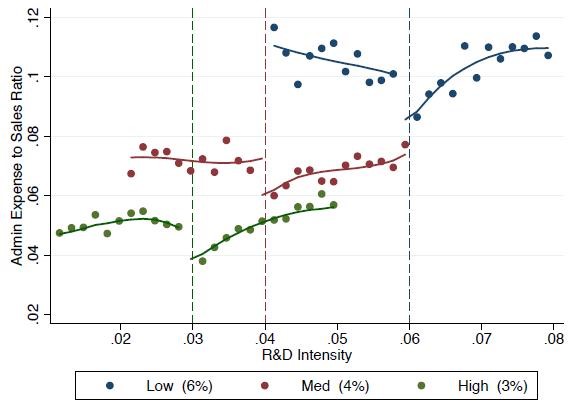
The striking nature of Figures 2-4 raises the concern that these bunching responses may be due to relabeling and may not represent real investment. We explore this hypothesis by exploiting the fact that, under Chinese Accounting Standards, R&D is reported as a subcategory of “Administrative Expenses.” We thus look for evidence of relabeling by studying the ratio of non-R&D administrative expenses to sales. Figure 5 explores how this ratio is related to R&D intensity. This figure groups firms into bins of R&D intensity and plots the mean non-R&D admin expense-to-sales ratio for each bin. We report the data along with an estimated cubic regression of the expense ratio on R&D intensity with heterogeneous coefficients above and below the notches. For each size category, there is an obvious discontinuous decrease in non-R&D administrative expenses at each threshold. Once the firms get further away from the bunching threshold, there is no systemic difference of the admin expense-to-sales ratio for firms with either low or high R&D intensities. This pattern is consistent with the hypothesis that firms relabel non-R&D expenses as R&D when they are near the bunching thresholds. Combined, Figures 2-5 provide strong qualitative evidence that firms actively respond to the incentives in the InnoCom program by increasing reported R&D investment, and by relabeling administrative costs as R&D.
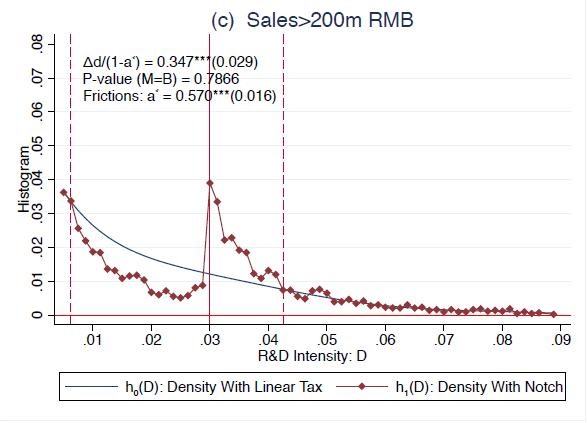
We develop an empirical model of firm R&D investment and use a cross-sectional “bunching” estimator that is new in the R&D literature (Kleven and Waseem, 2015). The estimator exploits the discontinuity in the empirical distribution of the observed R&D intensity. Using the firms that are not in the InnoCom program, the estimator predicts the smooth “counterfactual distribution” of InnoCom firms’ R&D decisions. The difference between the data and the “counterfactual distribution” allows us to quantify the increase in R&D investment. We focus on large firms (Sales>200 Million RMB), which account for the vast majority of R&D investment in China. Figure 6 plots the estimated counterfactual distribution, which implies an increase in R&D intensity of 35 percent. This estimate corresponds to the response of “complier” firms that are not otherwise constrained in their ability to respond to the incentives of the InnoCom program. We also find that 57 percent of the firms are not able to respond to the incentive.
Assessing the Cost-Effectiveness of the Policy
From the point of view of the Chinese government, it is useful to calculate the fiscal cost of encouraging R&D investment and increasing productivity. Our estimates imply that doubling R&D investment would cost the government 36.9 percent of corporate tax revenues. Similarly, we find that increasing TFP by 1 percent would cost the government a reduction of 4.8 percent in corporate tax revenues. These estimates are crucial ingredients for determining whether the InnoCom policy is too expensive, or whether externalities from R&D investment merit further subsidies. Overall, the effect of the policy on productivity growth suggests that policies that increase real R&D investment and limit relabeling opportunities may help transform the Chinese economy into one driven by growth in innovative and technology-intensive industries.
(Zhao Chen, Fudan University; Zhikuo Liu, Shanghai University of Finance and Economics; Juan Carlos Suárez Serrato, Duke University; Daniel Yi Xu, Duke University.)
References
Chen, Zhao, Liu, Zhikuo, Suárez Serrato, Juan Carlos, and Daniel Xu (2017), “Notching R&D Investment with Corporate Income Tax Cuts in China,” Working Paper, Duke University.Diamond, Rebecca, and Petra Persson (2016), “The Long-term Consequences of Teacher Discretion in Grading of High-Stakes Tests,” Working Paper, Stanford University.
Hall, Bronwyn, and John Van Reenen (2000), “How Effective are Fiscal Incentives for R&D? A Review of the Evidence,” Research Policy 29, pp. 449-469.
Kleven, Henrik J., and Mazhar Waseem (2013), “Using Notches to Uncover Optimization Frictions and Structural Elasticities: Theory and Evidence from Pakistan,” Quarterly Journal of Economics 128:2, pp. 669-723.

Latest
Most Popular
- VoxChina Covid-19 Forum (Second Edition): China’s Post-Lockdown Economic Recovery VoxChina, Apr 18, 2020
- China’s Great Housing Boom Kaiji Chen, Yi Wen, Oct 11, 2017
- China’s Joint Venture Policy and the International Transfer of Technology Kun Jiang, Wolfgang Keller, Larry D. Qiu, William Ridley, Feb 06, 2019
- The Dark Side of the Chinese Fiscal Stimulus: Evidence from Local Government Debt Yi Huang, Marco Pagano, Ugo Panizza, Jun 28, 2017
- Wealth Redistribution in the Chinese Stock Market: the Role of Bubbles and Crashes Li An, Jiangze Bian, Dong Lou, Donghui Shi, Jul 01, 2020
- Evaluating Risk across Chinese Housing Markets Yongheng Deng, Joseph Gyourko, Jing Wu, Aug 02, 2017
- What Is Special about China’s Housing Boom? Edward L. Glaeser, Wei Huang, Yueran Ma, Andrei Shleifer, Jun 20, 2017
- Privatization and Productivity in China Yuyu Chen, Mitsuru Igami, Masayuki Sawada, Mo Xiao, Jan 31, 2018
- Daily Price Limits and the Magnet Effect Ting Chen, Zhenyu Gao, Jibao He, Wenxi Jiang, Wei Xiong, Oct 25, 2017
- How did China Move Up the Global Value Chains? Hiau Looi Kee, Heiwai Tang, Aug 30, 2017


