A Bridge on Economic Issues between China and the World


 Facebook
  Twitter
  Instagram
 WeChat
  Email
Email Evaluating Risk across Chinese Housing Markets

We bring new Chinese housing market data and analysis to the study of supply and demand conditions. There is substantial variation in supply–demand balances across markets. Bigger inventory overhangs predict lower house price growth the next year.
The spectacular ongoing housing boom in China has generated global concern about the risk of a housing bust and its impact on the Chinese economy and the world economy (Glaeser et al., 2017). Such worries are not unwarranted, as the real estate sector is very large in China. As a proportion of output in 2016, the real estate industry accounted for a sizeable 6.5%, while that of the construction industry stood at 6.7%.
This article examines the risks across China's housing markets and provides new data and analyses that shed light on the supply and demand conditions of 35 major cities (See Note 1). In addition to the Tier 1 markets of Beijing, Shanghai, Guangzhou, and Shenzhen, the sample also includes numerous Tier 2 and Tier 3 cities. We also document variation in supply–demand (im)balances across these markets and find substantial heterogeneity, with some markets being overbuilt and others experiencing excess demand. Finally, we also show that one measure of excess supply in a market predicts weak future house price growth in that market, so that overbuilding is an important risk factor.Key Findings:
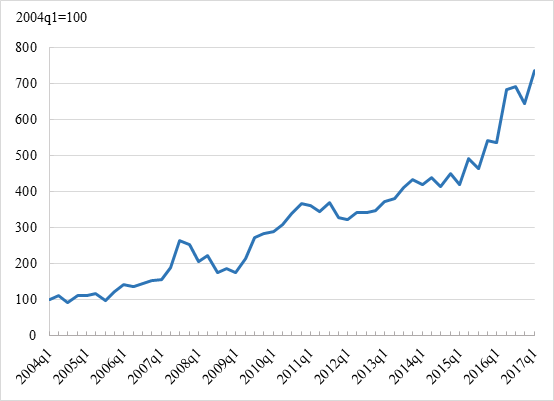
1. Rising real prices are due primarily to land value appreciation, not escalating real construction costs.Real land prices have increased substantially across China’s major cities, exhibiting a 15.3% average annual increase since 2004 as plotted in Figure 1 (See Note 2). This robust averagemasks stark variation across cities, as indicated by Beijing’s 25.6% implied per annum compound growth rate over the past 13 years (2004–2016 for an aggregate real appreciation of 1,538%).
Figure 1: Chinese national real residential land price index, 35 markets,
constant quality series (2004q1–2017q1)
2. Variation across markets is substantial: China is not a single market, but a series of local markets with different conditions and outcomes.
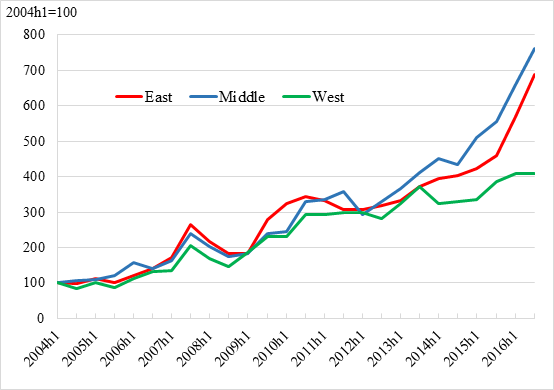
The underlying data also show that it is a mistake to perceive the Chinese housing market as a single national market. Real land prices are strongly positively correlated across China’s three census regions, as shown in Figure 2 (which disaggregates the aggregate data in Figure 1). Even so, there are growing divergences, with cities in the West region materially underperforming those in other parts of the country. Real, constant quality land price growth ranges from 310% in the West region to 661% in the Middle region.
Figure 2: Chinese regional real residential land price indexes — East, Middle and West regions, constant quality series (2004h1–2016h2)
In a noteworthy effort to improve the quality of house price measurement, Wu, Deng, and Liu (2014) use a hedonic model to create a constant-quality house price index based directly on micro transactions data of all newly built housing units in the 35-city sample. It suggests a higher appreciation rate than what the government-provided Average Price Index reports for most, but not all, 35 markets. We view its index construction as superior because it is directly based on micro-level transactions data, with an additional effort made to control for changing trait quality over time. Those data show very high real house price appreciation rates, with an average of about 10% per annum for 35 major markets over the past decade. There is wide variation in growth across markets, ranging from 2.8% (Jinan) to 19.8% (Beijing). These series also emphasize the outsized role of rising land values in accounting for the growth in house prices.
3. Supply-demand (im)balances also vary greatly across markets
Prices reflect the intersection of supply and demand, so it is useful to look at both supply and demand across markets. It is well known that demand-side fundamentals tend to be quite strong in most Chinese housing markets. The Chinese census indicates that over 212,000,000 more people lived in Chinese cities in 2010 than in 2000. That is two-thirds of the population of the United States, so there is no doubt that the demand for urban housing has been growing in recent years. However, it is possible for developers to overbuild even during the strong demand period.
Buildable floor space in aggregate housing starts in the 35 major cities fluctuated between 200 and 300 million square meters before 2009, but then jumped by about 50% to over 450 million square meters in 2010 following the credit surge associated with the Chinese stimulus. Even with the downturn in 2014, the level of space delivered remains well above that seen prior to the stimulus period.
One needs more than modest growth in demand to keep pace with a surge in supply that large. For many cities, that growth did materialize, but not in others. During the period between 2001 and 2010, growth in the number of households needing a housing unit exceeded the increase in the supply of units by nearly 14% in aggregate. However, there was an oversupply of units relative to households of about 26% in 2011–2014, which resulted in supply roughly matching demand over the full 2001–2014 period. However, as with the price series, that aggregate average masks important heterogeneity across markets (Wu, Gyourko, and Deng, 2016)
We estimate that net new supply has exceeded the net increase in households by at least 30% in thirteen markets: Chongqing, Chengdu, Guiyang, Harbin, Hohhot, Lanzhou, Qingdao, Shenyang, Taiyuan, Tianjin, Xining, Yinchuan, and Zhengzhou. Another eleven saw net new supply exceed net new demand from 10%–30% (Changchun, Changsha, Dalian, Fuzhou, Hefei, Kunming, Nanning, Shijiazhuang, Wuhan, Xiamen, and Xi’an). The other 11 markets in our sample either saw net supply outpace demand by less than 10% (which is a magnitude we consider well within the range of our computation error) or experienced excess demand for housing. This latter group includes many of the largest markets in the East region of China such as Beijing, Guangzhou, Shanghai, and Shenzhen, as well as other coastal markets such as Hangzhou and Nanjing.
It is also the case that excess supply matters, as regression results indicate that a one standard deviation higher ratio of developers' unsold inventory in a market (scaled by market size) is associated with a 0.45 standard deviation lower rate of real house price growth the following year.
Conclusion
Given data limitations, it is not feasible to convincingly estimate whether there is a "bubble" in any given Chinese housing market. However, it is possible to gauge the riskiness of different markets. Such an analysis shows that there is much variation in supply–demand conditions and in housing and land price growth across markets. Real price growth has been robust since the early 2000s across virtually all major markets, but not all markets have experienced anything like the surge seen in Beijing or the other Tier 1 markets. Price growth in West region cities has begun to slow appreciably. A more detailed look at the city level shows a large number of interior markets appear to be substantially overbuilt in the sense that the net addition to the housing stock since the turn of the century has exceeded the growth in households in those cities.
The worst housing market downturns arise from a combination of weakening demand and excess supply. Because housing is so durable, one cannot rely on rapid depreciation to reduce supply; for real estate, growth is the only way out of such a downturn. This makes the many overbuilt markets in China very risky. And our analysis shows that this characterizes many major markets, not just smaller, so-called "ghost cities" in outlying northern or far western provinces. This is not to say that these markets are destined to suffer price collapses. Our empirical analysis shows that supply overhangs do dampen price appreciation, but that does not mean prices will fall appreciably, as a sizable negative demand shock to the local or regional economy is also needed. However, the underlying conditions are ripe for material price declines in these places if broader economic conditions deteriorate.
The situation in Beijing and other Tier 1 cities is more nuanced. Our analysis suggests that they are not oversupplying housing; in fact, the converse is true, as these places continue to experience excess demand. However, this does not mean these markets are not risky. They are because they are priced to perfection. Housing trades at very high price-to-rent multiples (>50 in Beijing according to our data). Poterba’s (1984) famous user cost of housing framework suggests that markets like this can suffer dramatic price declines from small adverse changes in interest rates or expectations of future price growth.
That financial risk is high in most Chinese housing markets does not mean severely adverse outcomes are inevitable. Westerners in particular need to keep content in mind when evaluating China’s housing market. High house price growth rates are not so surprising when the broader economy is growing at high rates; they are also not so surprising when prices start from such low absolute levels, as they did in China following the Deng-era reforms at the end of the previous century. High urban income growth rates also have allowed Chinese households to "grow into" affordable housing (Fang, et al., 2015).
But, these caveats also highlight potential risk factors ripe for future research. For example, anything that weakens urban wage growth is a serious threat to housing affordability in China. Extremely high appreciation rates no longer come off a low price base, so property market fundamentals would have to materially strengthen for such price growth to make good economic sense in the future. And the old real estate adage about "location, location, location" being critical for valuations certainly appears to be true in China too. It is a mistake to think of the housing market as an aggregate national whole. Housing markets are local and vary widely by city, because economic conditions vary so much across Chinese cities. If we keep our analysis focused on these issues going forward, our insight into Chinese housing market risk and performance will be much better.
Note 1: See Wu, Gyourko, and Deng (2016) for a more complete analysis of the supply and demand conditions across Chinese housing markets.
Note 2: This series is from the Chinese Residential Land Price Index (CRLPI), first published in Deng, Gyourko, and Wu (2014), updated quarterly since then. See Deng, Gyourko, and Wu (2012, 2014) for the details behind the index. It is a constant-quality, residential land price index based on sales of long-term leasehold estates to private developers in 35 large cities spread across the country.
Note 3: The data are from the National Bureau of Statistics of China (NBSC), based on surveys conducted by local statistical agents.
Note 4: This is the government-provided series on the average selling price of newly built residential buildings. Since the mid-1990s, real estate developers in China have been required to report a variety of business indicators to the government statistics agency, including the total volume (in floor area) of newly built housing units sold within each sampling period and the aggregate sales price of these units. Dividing the total price paid by total floor area of the transacted units, weighted average house prices per square meter are calculated and reported at the city, province, and national level, respectively.
(Yongheng Deng, NUS Business School, School of Design and Environment, and Institute of Real Estate Studies, National University of Singapore, Singapore; Joseph Gyourko, The Wharton School, University of Pennsylvania and NBER, United States; Jing Wu, Institute of Real Estate Studies and Hang Lung Center for Real Estate, Tsinghua University, China)
Deng, Yongheng, Joseph Gyourko, and Jing Wu. (2012). Land and house price measurement in China. In A. Heath, F. Packer, & C. Windsor (Eds.), Property markets and financial stability. Bank of International Settlement and Reserve Bank of Australia.
Deng, Yongheng, Joseph Gyourko, and Jing Wu. (2014). The Wharton/NUS/Tsinghua Chinese Residential Land Price Indexes (CRLPI) White Paper. Working paper. National University of Singapore.
Fang, Hanming, Quanlin Gu, Wei Xiong, Li-An Zhou. (2015) Demystifying the Chinese Housing Boom, In NBER Macroeconomics Annual 2015, Volume 30. Edited by Eichenbaum and Parker.
Glaeser, Edward, Wei Huang, Yueran Ma, and Andrei Shleifer. (2017). A real estate boom with Chinese characteristics. Journal of Economic Perspective, 31(1), 93-116.
Poterba, J. (1984). Tax subsidies to owner-occupied housing: An asset market approach. Quarterly Journal of Economics, 99(4), 729–752.
Wu, Jing, Yongheng Deng, and Hongyu Liu. (2014). House price index construction in the nascent housing market: The case of China. Journal of Real Estate Finance and Economics, 48(3), 522–545.
Wu, Jing, Joseph Gyourko, and Yongheng Deng. (2016) “Evaluating the Risk of Chinese Housing Markets: What We Know and What We Need to Know,” China Economic Review, 39, 91-114.

Latest
Most Popular
- VoxChina Covid-19 Forum (Second Edition): China’s Post-Lockdown Economic Recovery VoxChina, Apr 18, 2020
- China’s Great Housing Boom Kaiji Chen, Yi Wen, Oct 11, 2017
- China’s Joint Venture Policy and the International Transfer of Technology Kun Jiang, Wolfgang Keller, Larry D. Qiu, William Ridley, Feb 06, 2019
- The Dark Side of the Chinese Fiscal Stimulus: Evidence from Local Government Debt Yi Huang, Marco Pagano, Ugo Panizza, Jun 28, 2017
- Wealth Redistribution in the Chinese Stock Market: the Role of Bubbles and Crashes Li An, Jiangze Bian, Dong Lou, Donghui Shi, Jul 01, 2020
- What Is Special about China’s Housing Boom? Edward L. Glaeser, Wei Huang, Yueran Ma, Andrei Shleifer, Jun 20, 2017
- Evaluating Risk across Chinese Housing Markets Yongheng Deng, Joseph Gyourko, Jing Wu, Aug 02, 2017
- Privatization and Productivity in China Yuyu Chen, Mitsuru Igami, Masayuki Sawada, Mo Xiao, Jan 31, 2018
- How did China Move Up the Global Value Chains? Hiau Looi Kee, Heiwai Tang, Aug 30, 2017
- China’s Shadow Banking Sector: Wealth Management Products and Issuing Banks Viral V. Acharya, Jun Qian, Zhishu Yang, Aug 09, 2017


