A Bridge on Economic Issues between China and the World


 Facebook
  Twitter
  Instagram
 WeChat
  Email
Email Privatization and Productivity in China

Privatization has boosted Chinese firms’ productivity, both in the short run and the long run. Consumer-oriented industries saw larger gains than “strategic” (heavily regulated) sectors. Chinese patents and “new product” surveys seem less reliable, because any statistics become useless once they become policy targets.
In the long run, living standards depend on the productivity of the economy. Different kinds of companies have different levels of productivity. It is important, therefore, to ensure that a healthy mix of productive firms populates the economy.
Once upon a time, China’s state-owned enterprises (SOEs) were the pillars of the socialist economy, generating most of the government’s revenues. But the entire SOE sector generated a net fiscal loss in 1995, despite earlier restructuring efforts. Subsequently, the Communist Party adopted a new policy of privatization in 1997.
“Grasp the large; let go of the small” was the slogan of privatization, which meant that the central planners prioritized the off-loading (i.e., liquidation, forced merger, or privatization) of small, loss-making SOEs. By the same token, the party declared the private sector an “important element of socialist market economy,” thereby finally giving it official approval.
Privatization by Management Buy-Out
The number of SOEs decreased by more than half from approximately 238,000 in 1998 to 116,000 in 2007. The largest, centrally administered SOEs were kept under state control, but most of the local SOEs were sold to private hands. Most of the new owners of the privatized firms were the managers of the same SOEs before privatization.
Whether a given SOE became the target of off-loading was a decision made by the central planners, but the exact mode and outcome of restructuring were often negotiable. For example, both Huajing Electronics and Northeast Pharmaceutical were large SOEs, but part of the former was privatized in the form of joint venture with a Hong Kong firm, whereas the latter managed to turn around as an SOE and became one of the world's top makers of vitamin C (Yuan (2009), ch. 4; Igami and Sugaya (2017), Appendix A.2). Bei (2014) conducted systematic in-depth interviews of the owners and managers of seven newly privatized firms, six of which went through privatization by management buy-out (MBO) despite the government's initial inclination to shut them down.
The prevalence of MBO among those successfully privatized firms does not mean the managers of SOEs could freely choose to privatize. Wu (2008) chronicles the business history of 38 famous firms between 1978 and 2007, 24 of which belonged to the public sector, according to Watanabe's (2013) analysis. Only one of them was successfully privatized by MBO, whereas eight others experienced some sort of conflict with the government and typically ended in the arrest of managers and in liquidation. The government clearly has the upper hand.
Privatization does not change everything overnight. In fact, all seven successful cases in Bei (2014) feature former SOEs that retained their core technologies, management teams, physical assets, and the majority of their labor force from the SOE era. What changed was the increase in managerial freedom, including product choice, technology choice, marketing, investment, and the design of incentive schemes.
Productivity Dynamics after Privatization
Measuring privatization and productivity is not an easy task. Privatization involves a political process, and the state and SOEs each have their own agenda and priorities. Theories predict such “selection” patterns could be complicated.
Our recent study (Chen, Igami, Sawada, and Xiao 2017, henceforth “CISX”) tackles this problem by crafting a new analytical framework to accommodate the rich dynamics of productivity (Exhibit 1).
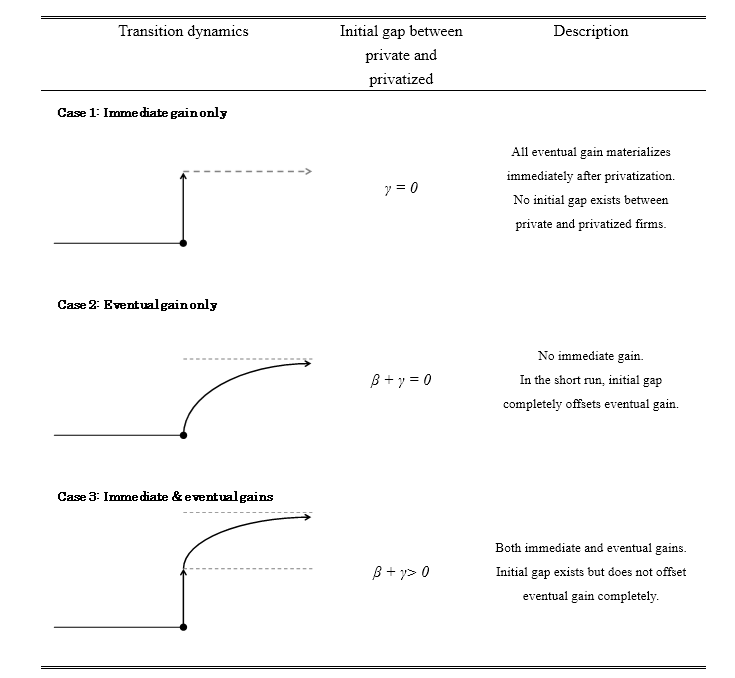
Note: This figure illustrates three qualitatively different time paths of productivity dynamics after privatization. In the middle column, β represents private firms’ long-term TFP premium relative to SOEs (assumed to be positive in these diagrams for expositional purposes), whereas γ is the initial gap between already-private firms and just-privatized firms.
The productivity boost from privatization could happen relatively quickly, if the change of ownership allows the firm to change its pricing and marketing strategies. That’s Case 1 in Exhibit 1, where all of the productivity gain is immediate (γ=0 in the middle column means that there is no remaining “gap” between the recently-privatized firm and an average private firm).
However, not everything changes overnight in the real world. The other extreme is the case where all of the productivity gains happen only in the long run, not the short run. Case 2 illustrates such a trajectory, where β+γ= 0 (or equivalently, β= –γ) means the initial “gap” (γ) is big and has to be filled by the long-run process of catch-up (β).
The reality would lie somewhere between these two extremes. Case 3 plots a trajectory with both immediate and eventual gains.
Methods of “Industrial Organization” Economics
Conceptually speaking, productivity is high when a company produces a lot of outputs from only a small amount of inputs. Conversely, productivity is low when small outputs come from a lot of inputs. In principle, therefore, we can get a sense of productivity by simply dividing the outputs by the inputs.
In practice, however, competent managers would do business on a good day differently than they would on a bad day. They would also adjust their investments in machines, personnel, and technology, based on their sense of the current and future market environments. The research challenge is that none of these managerially-relevant pieces of information is on record.
Fortunately, three decades of advances in Industrial Organization (IO) economics made productivity measurement possible, even under such uncertain data environments. Recently developed methods by Ackerberg, Caves, and Frazer (2015) as well as Gandhi, Navarro, and Rivers (2016) allow us to take advantage of the timing of managers’ investment decisions and input-procurement decisions. As a result, we can successfully tease out the statistical relationships between outputs and inputs in a fairly flexible manner.
Exhibit 2 visualizes such input-output relationships for three different inputs (K: capital, L: labor, and M: materials, in rows) for three different types of firms (SOE, Collective, and Private, in columns). The vertical axis is output, so the graphs show how output increases with the three inputs, at three different kinds of firms.
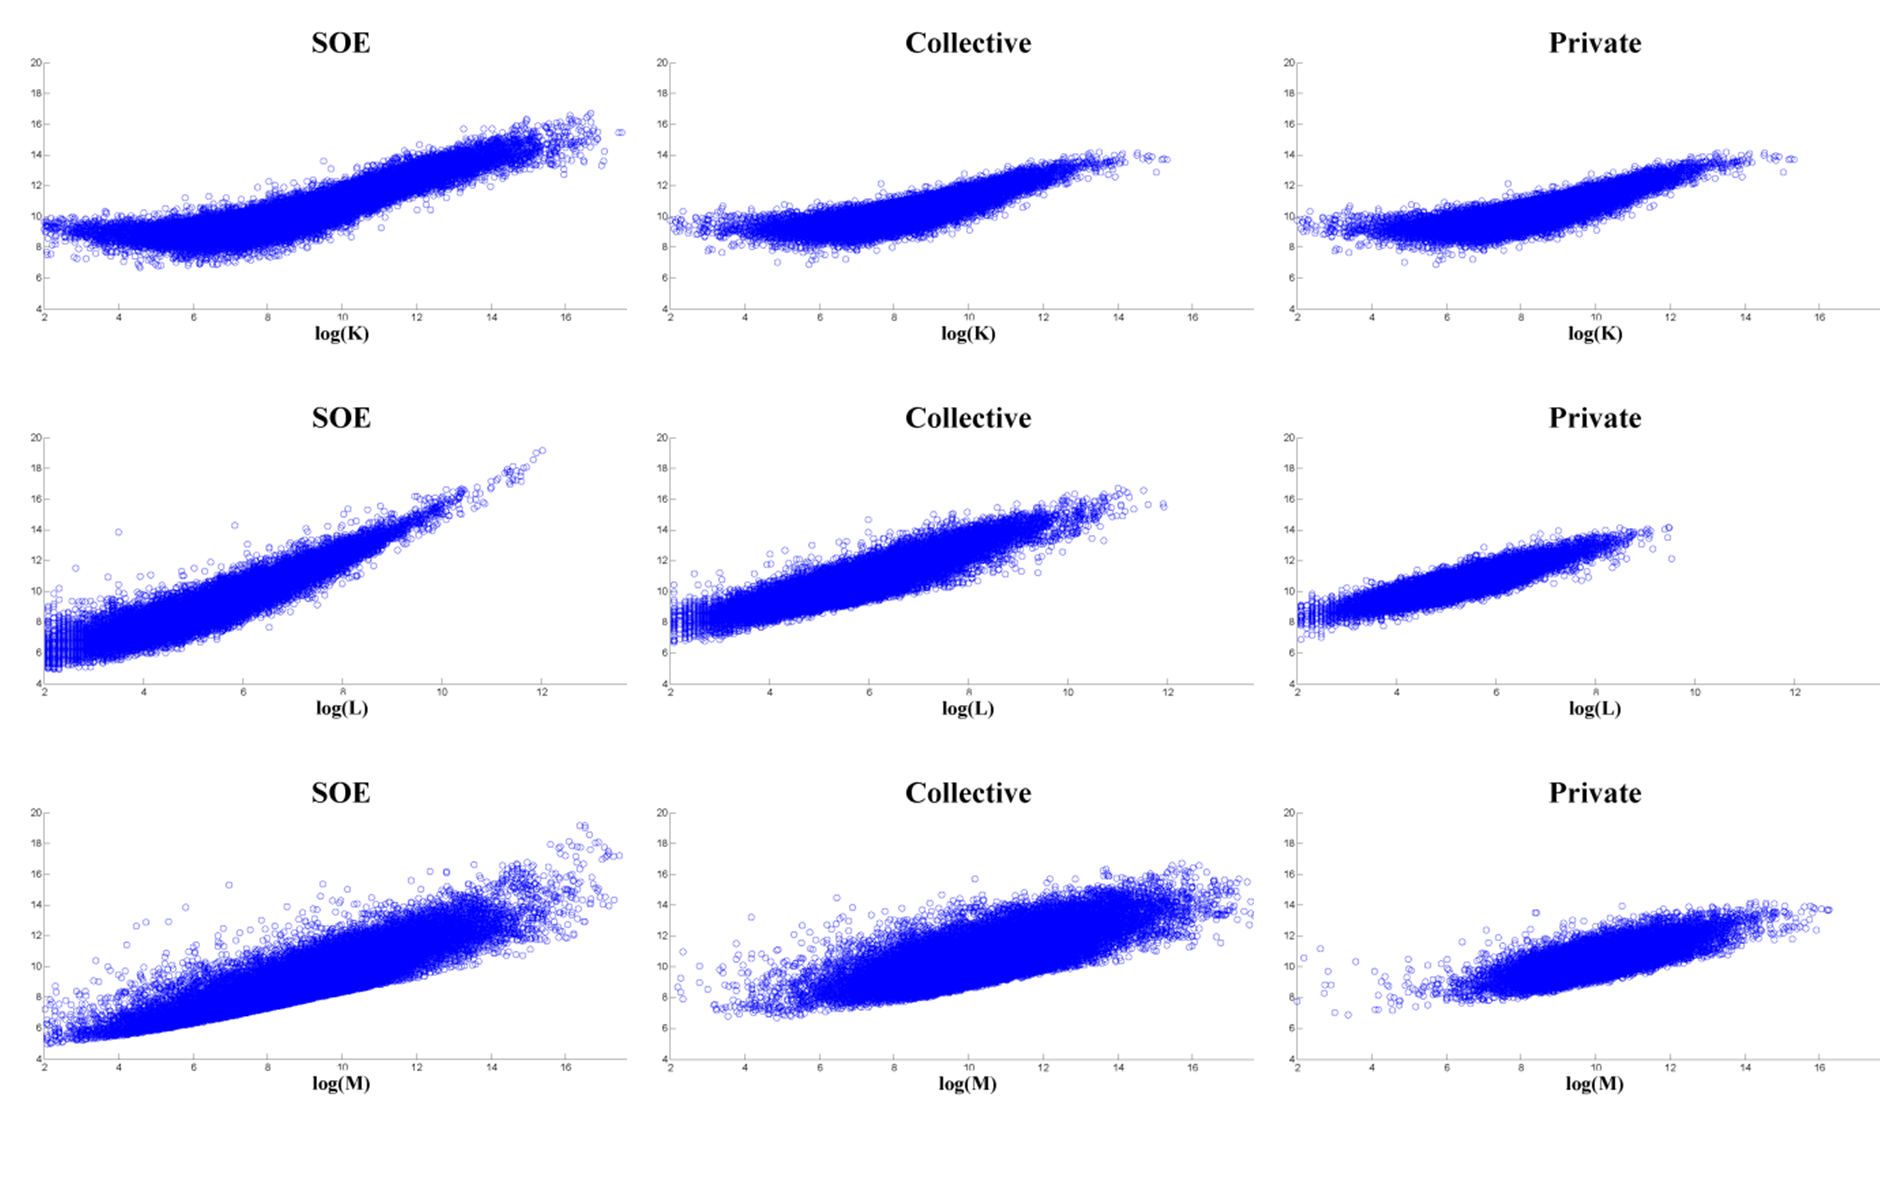
Note: Each figure plots the deterministic part of the Gandhi-Navarro-Rivers production-function estimate, f, against an input. Each circle represents one of the 195,980 firm-year observations.
Privatization Boosts Productivity, Now and Later
Exhibit 3 lists the final estimates of productivity for 12 different industries (in rows, labeled in column 1). Columns 2 and 3 show the long-run (β) and the short-run (β + γ) productivity gains after privatization. The other columns provide supplementary information, such as the capital/labor-intensity of industries, and the number of relevant data points. Three major findings emerged.
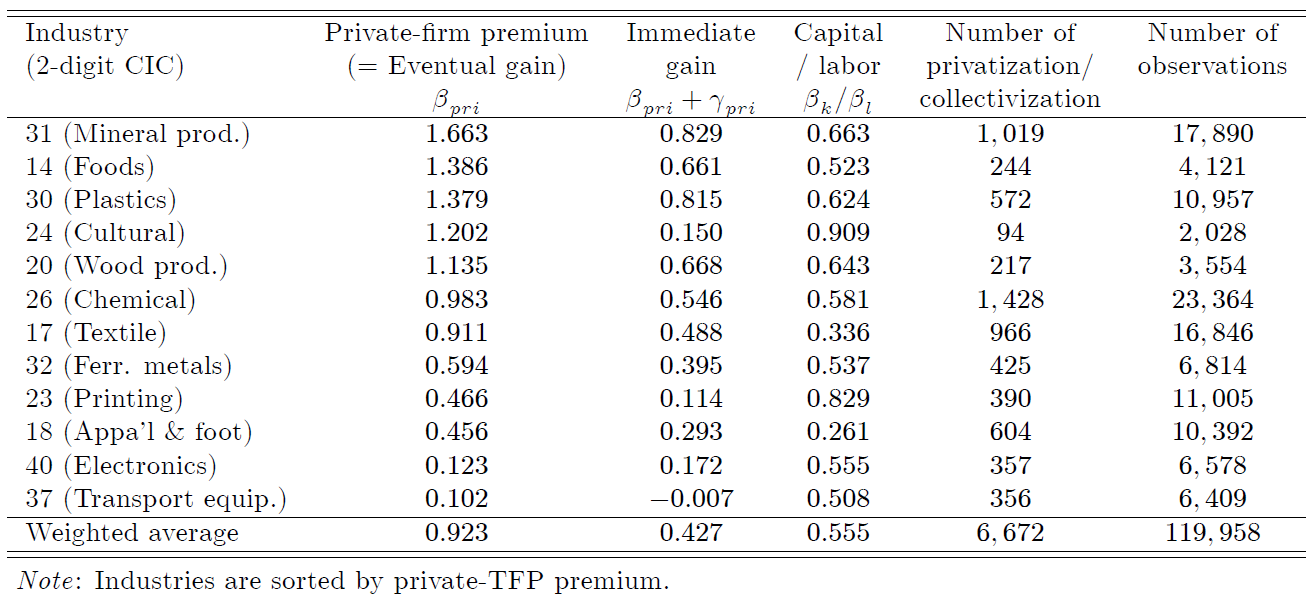
First, privatization generates a 43% productivity gain in the short run and an additional 50% increase in the long run. Nearly all industries share the same qualitative pattern of productivity dynamics with both the immediate and eventual gains (“Case 3” in Exhibit 1).
Second, these gains from privatization are more pronounced in consumer-oriented industries with differentiated products compared to capital-goods industries, presumably because the extra degree of managerial freedom is particularly valuable when catering to diverse tastes on the demand side. By contrast, “strategic” (i.e., regulated) industries such as car manufacturing, exhibit either negligible total factor productivity (TFP) premia for private ownership or unreliable estimates.
Third, measures of “innovation” (other than productivity) look very different. One direct indicator is “new products” in the Annual Survey of Industrial Enterprises (ASIE). Another innovation-related statistic is Chinese patents. CISX conducted regressions using these alternative variables and found patterns that are systematically different from their productivity estimates.
SOEs tend to report more “new product” revenues and more patents despite their underwhelming performance in terms of TFP, which would seem to suggest their struggle to commercialize and monetize inventions and/or political motives to file patent applications across different types of firms. (See, for example, The Economist’s article “Back to business: Special Report on Business in China” from September 2015.)
Lessons Learned
Analysts would need to use extreme caution when trying to infer the underlying innovative activities based on these direct measures of “innovation.” The finding that different statistics on innovation paint radically different pictures resonates with some of the classical pieces in economic research, such as Griliches (1990)
The central planners need to embrace the reality that any statistics become useless (as a measure of economic activity) once they become policy targets. “New products” and “Chinese patents” could suffer such biases, in our case.
Corporate officers, as well as regional government officials, would strive to achieve whatever policy goals the central government announces. They are intensely motivated by prizes, subsidies, promotions, and other favors offered by policymakers. And these extra efforts might come at the expense of truly valuable innovations.
As China aspires to become an innovation powerhouse in the coming decades, this lesson is increasingly relevant both for scholars and for policymakers, and it applies to all other nations that are trying to keep abreast of Chinese innovations.
(Yuyu Chen, Guanghua School of Management, Peking University, and Director of Institute of Economic Policy Research of Peking University; Mitsuru Igami, Yale Department of Economics, and Visiting Associate Professor at MIT Department of Economics; Masayuki Sawada, Ph.D candidate at Yale Department of Economics; Mo Xiao, Department of Economics, Eller College of Management, The University of Arizona.)
Ackerberg, Daniel A., Kevin Caves, and Garth Frazer (2015). “Identification Properties of Recent Production Function Estimators,” Econometrica, 83 (6): 2411-2451.
Bei, Lei (2014). Chugoku chuushou kigyou no kigyou, keiei, jinzai kanri: Mineika kigyou no tayouka ni semaru [Entrepreneurship, Management, and Human Resources of Small and Medium-sized Firms in China: Diversity of Privatized Enterprises]. Tokyo: Keiso Shobo.
Gandhi, Amit, Salvador Navarro, and David Rivers (2016). “On the Identification of Production Functions: How Heterogeneous is Productivity?” Working paper, University of Wisconsin-Madison.
Griliches, Zvi (1990). “Patent Statistics as Economic Indicators: A Survey,” Journal of Economic Literature, 28: 1661-1707.
Igami, Mitsuru, and Takuo Sugaya (2017). “Measuring the Incentive to Collude: The Vitamin Cartels, 1990-1999,” Working paper, Yale University.
Watanabe, Mariko (2013). “Ousei na sannyu to shikin seiyaku” [Vigorous Entry and Cash Constraints: Entrepreneur’ s Innovation Dodging State Capitalism], China 21, 38: 27-50.
In the long run, living standards depend on the productivity of the economy. Different kinds of companies have different levels of productivity. It is important, therefore, to ensure that a healthy mix of productive firms populates the economy.
Once upon a time, China’s state-owned enterprises (SOEs) were the pillars of the socialist economy, generating most of the government’s revenues. But the entire SOE sector generated a net fiscal loss in 1995, despite earlier restructuring efforts. Subsequently, the Communist Party adopted a new policy of privatization in 1997.
“Grasp the large; let go of the small” was the slogan of privatization, which meant that the central planners prioritized the off-loading (i.e., liquidation, forced merger, or privatization) of small, loss-making SOEs. By the same token, the party declared the private sector an “important element of socialist market economy,” thereby finally giving it official approval.
Privatization by Management Buy-Out
The number of SOEs decreased by more than half from approximately 238,000 in 1998 to 116,000 in 2007. The largest, centrally administered SOEs were kept under state control, but most of the local SOEs were sold to private hands. Most of the new owners of the privatized firms were the managers of the same SOEs before privatization.
Whether a given SOE became the target of off-loading was a decision made by the central planners, but the exact mode and outcome of restructuring were often negotiable. For example, both Huajing Electronics and Northeast Pharmaceutical were large SOEs, but part of the former was privatized in the form of joint venture with a Hong Kong firm, whereas the latter managed to turn around as an SOE and became one of the world's top makers of vitamin C (Yuan (2009), ch. 4; Igami and Sugaya (2017), Appendix A.2). Bei (2014) conducted systematic in-depth interviews of the owners and managers of seven newly privatized firms, six of which went through privatization by management buy-out (MBO) despite the government's initial inclination to shut them down.
The prevalence of MBO among those successfully privatized firms does not mean the managers of SOEs could freely choose to privatize. Wu (2008) chronicles the business history of 38 famous firms between 1978 and 2007, 24 of which belonged to the public sector, according to Watanabe's (2013) analysis. Only one of them was successfully privatized by MBO, whereas eight others experienced some sort of conflict with the government and typically ended in the arrest of managers and in liquidation. The government clearly has the upper hand.
Privatization does not change everything overnight. In fact, all seven successful cases in Bei (2014) feature former SOEs that retained their core technologies, management teams, physical assets, and the majority of their labor force from the SOE era. What changed was the increase in managerial freedom, including product choice, technology choice, marketing, investment, and the design of incentive schemes.
Productivity Dynamics after Privatization
Measuring privatization and productivity is not an easy task. Privatization involves a political process, and the state and SOEs each have their own agenda and priorities. Theories predict such “selection” patterns could be complicated.
Our recent study (Chen, Igami, Sawada, and Xiao 2017, henceforth “CISX”) tackles this problem by crafting a new analytical framework to accommodate the rich dynamics of productivity (Exhibit 1).
Exhibit 1: Possible Dynamics of Productivity after Privatization
Note: This figure illustrates three qualitatively different time paths of productivity dynamics after privatization. In the middle column, β represents private firms’ long-term TFP premium relative to SOEs (assumed to be positive in these diagrams for expositional purposes), whereas γ is the initial gap between already-private firms and just-privatized firms.
The productivity boost from privatization could happen relatively quickly, if the change of ownership allows the firm to change its pricing and marketing strategies. That’s Case 1 in Exhibit 1, where all of the productivity gain is immediate (γ=0 in the middle column means that there is no remaining “gap” between the recently-privatized firm and an average private firm).
However, not everything changes overnight in the real world. The other extreme is the case where all of the productivity gains happen only in the long run, not the short run. Case 2 illustrates such a trajectory, where β+γ= 0 (or equivalently, β= –γ) means the initial “gap” (γ) is big and has to be filled by the long-run process of catch-up (β).
The reality would lie somewhere between these two extremes. Case 3 plots a trajectory with both immediate and eventual gains.
Methods of “Industrial Organization” Economics
Conceptually speaking, productivity is high when a company produces a lot of outputs from only a small amount of inputs. Conversely, productivity is low when small outputs come from a lot of inputs. In principle, therefore, we can get a sense of productivity by simply dividing the outputs by the inputs.
In practice, however, competent managers would do business on a good day differently than they would on a bad day. They would also adjust their investments in machines, personnel, and technology, based on their sense of the current and future market environments. The research challenge is that none of these managerially-relevant pieces of information is on record.
Fortunately, three decades of advances in Industrial Organization (IO) economics made productivity measurement possible, even under such uncertain data environments. Recently developed methods by Ackerberg, Caves, and Frazer (2015) as well as Gandhi, Navarro, and Rivers (2016) allow us to take advantage of the timing of managers’ investment decisions and input-procurement decisions. As a result, we can successfully tease out the statistical relationships between outputs and inputs in a fairly flexible manner.
Exhibit 2 visualizes such input-output relationships for three different inputs (K: capital, L: labor, and M: materials, in rows) for three different types of firms (SOE, Collective, and Private, in columns). The vertical axis is output, so the graphs show how output increases with the three inputs, at three different kinds of firms.
Exhibit 2: Nonparametric Production-Function Estimates
Privatization Boosts Productivity, Now and Later
Exhibit 3 lists the final estimates of productivity for 12 different industries (in rows, labeled in column 1). Columns 2 and 3 show the long-run (β) and the short-run (β + γ) productivity gains after privatization. The other columns provide supplementary information, such as the capital/labor-intensity of industries, and the number of relevant data points. Three major findings emerged.
Exhibit 3: Productivity Estimates by Industry
First, privatization generates a 43% productivity gain in the short run and an additional 50% increase in the long run. Nearly all industries share the same qualitative pattern of productivity dynamics with both the immediate and eventual gains (“Case 3” in Exhibit 1).
Second, these gains from privatization are more pronounced in consumer-oriented industries with differentiated products compared to capital-goods industries, presumably because the extra degree of managerial freedom is particularly valuable when catering to diverse tastes on the demand side. By contrast, “strategic” (i.e., regulated) industries such as car manufacturing, exhibit either negligible total factor productivity (TFP) premia for private ownership or unreliable estimates.
Third, measures of “innovation” (other than productivity) look very different. One direct indicator is “new products” in the Annual Survey of Industrial Enterprises (ASIE). Another innovation-related statistic is Chinese patents. CISX conducted regressions using these alternative variables and found patterns that are systematically different from their productivity estimates.
SOEs tend to report more “new product” revenues and more patents despite their underwhelming performance in terms of TFP, which would seem to suggest their struggle to commercialize and monetize inventions and/or political motives to file patent applications across different types of firms. (See, for example, The Economist’s article “Back to business: Special Report on Business in China” from September 2015.)
Lessons Learned
Analysts would need to use extreme caution when trying to infer the underlying innovative activities based on these direct measures of “innovation.” The finding that different statistics on innovation paint radically different pictures resonates with some of the classical pieces in economic research, such as Griliches (1990)
The central planners need to embrace the reality that any statistics become useless (as a measure of economic activity) once they become policy targets. “New products” and “Chinese patents” could suffer such biases, in our case.
Corporate officers, as well as regional government officials, would strive to achieve whatever policy goals the central government announces. They are intensely motivated by prizes, subsidies, promotions, and other favors offered by policymakers. And these extra efforts might come at the expense of truly valuable innovations.
As China aspires to become an innovation powerhouse in the coming decades, this lesson is increasingly relevant both for scholars and for policymakers, and it applies to all other nations that are trying to keep abreast of Chinese innovations.
(Yuyu Chen, Guanghua School of Management, Peking University, and Director of Institute of Economic Policy Research of Peking University; Mitsuru Igami, Yale Department of Economics, and Visiting Associate Professor at MIT Department of Economics; Masayuki Sawada, Ph.D candidate at Yale Department of Economics; Mo Xiao, Department of Economics, Eller College of Management, The University of Arizona.)
References
Ackerberg, Daniel A., Kevin Caves, and Garth Frazer (2015). “Identification Properties of Recent Production Function Estimators,” Econometrica, 83 (6): 2411-2451.
Bei, Lei (2014). Chugoku chuushou kigyou no kigyou, keiei, jinzai kanri: Mineika kigyou no tayouka ni semaru [Entrepreneurship, Management, and Human Resources of Small and Medium-sized Firms in China: Diversity of Privatized Enterprises]. Tokyo: Keiso Shobo.
Gandhi, Amit, Salvador Navarro, and David Rivers (2016). “On the Identification of Production Functions: How Heterogeneous is Productivity?” Working paper, University of Wisconsin-Madison.
Griliches, Zvi (1990). “Patent Statistics as Economic Indicators: A Survey,” Journal of Economic Literature, 28: 1661-1707.
Igami, Mitsuru, and Takuo Sugaya (2017). “Measuring the Incentive to Collude: The Vitamin Cartels, 1990-1999,” Working paper, Yale University.
Watanabe, Mariko (2013). “Ousei na sannyu to shikin seiyaku” [Vigorous Entry and Cash Constraints: Entrepreneur’ s Innovation Dodging State Capitalism], China 21, 38: 27-50.
Yuan, Zhijia (2009). Gendai chugoku kigyou henkaku no ninaite: Tayouka suru kigyou seido to sono shoten [The Leading Figures of Firm Evolution in Modern China: Diversification of Firm Systems and the Core Issues]. Tokyo: Hihyosha.

Latest
Most Popular
- VoxChina Covid-19 Forum (Second Edition): China’s Post-Lockdown Economic Recovery VoxChina, Apr 18, 2020
- China’s Great Housing Boom Kaiji Chen, Yi Wen, Oct 11, 2017
- China’s Joint Venture Policy and the International Transfer of Technology Kun Jiang, Wolfgang Keller, Larry D. Qiu, William Ridley, Feb 06, 2019
- The Dark Side of the Chinese Fiscal Stimulus: Evidence from Local Government Debt Yi Huang, Marco Pagano, Ugo Panizza, Jun 28, 2017
- Wealth Redistribution in the Chinese Stock Market: the Role of Bubbles and Crashes Li An, Jiangze Bian, Dong Lou, Donghui Shi, Jul 01, 2020
- Evaluating Risk across Chinese Housing Markets Yongheng Deng, Joseph Gyourko, Jing Wu, Aug 02, 2017
- What Is Special about China’s Housing Boom? Edward L. Glaeser, Wei Huang, Yueran Ma, Andrei Shleifer, Jun 20, 2017
- Privatization and Productivity in China Yuyu Chen, Mitsuru Igami, Masayuki Sawada, Mo Xiao, Jan 31, 2018
- Daily Price Limits and the Magnet Effect Ting Chen, Zhenyu Gao, Jibao He, Wenxi Jiang, Wei Xiong, Oct 25, 2017
- How did China Move Up the Global Value Chains? Hiau Looi Kee, Heiwai Tang, Aug 30, 2017


