A Bridge on Economic Issues between China and the World


 Facebook
  Twitter
  Instagram
 WeChat
  Email
Email Exporting like China: The Determinants of Trade Status

We study the export decision of Chinese manufacturing firms, both public and privately owned enterprises. In 2019, China’s exports of goods accounted for 13% of goods exported in the world and around 20% of China’s GDP (see Note 1). The importance of understanding the determinants of trade patterns in China goes beyond its national borders. Observed export decisions contradict the prediction of the standard trade model in which exporters are more productive than non-exporters. Instead there is significant overlap in the distributions of productivity, particularly for private enterprises. To confront these observations, the economic framework stresses the dynamic decision by both state controlled and private entities to export in the face of labor adjustment costs. The analysis argues that labor adjustment costs along with variations in demand are needed to understand employment and trade dynamics.
Motivation
The standard approach to determining trade status rests on a simple and powerful rule: high productivity firms are exporters, others only sell domestically. But, at least for China, this simple prediction misses key elements of the picture.
Figure 1: Distributions of Average Revenue Labor Product
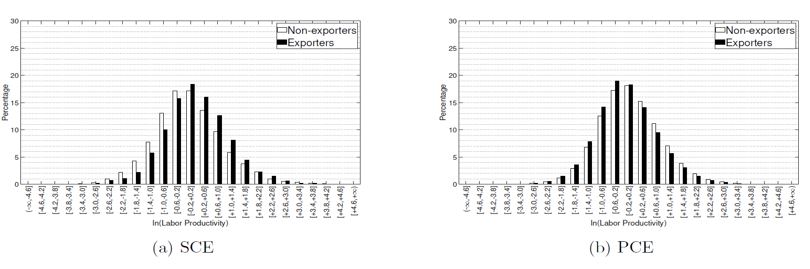
This figure shows the distributions of productivity, measured as average labor productivity (revenue per worker), for state and private controlled enterprises by export status. Year, industry, and location-fixed effects are removed.
This is clear from Figure 1 which shows the distributions of the average (revenue) product of labor across manufacturing plants in China. The data is presented by ownership type with the SCE being the state controlled enterprises and the PCE being the private controlled enterprises.
Our paper builds on three aspects of these figures (see Note 2). First, if selection into exporting is not determined by productivity alone, then what factors determine export status? This is a key question in our research.
Second, ownership matters. In Figure 1, exporters are a larger share of productive plants for the SCE while for PCE the opposite is true. Moreover, SCE having a low export share while almost 40% of the PCE, who export, have an export share over 95%. Why does ownership matter?
Finally, the attention paid to distributions of average revenue labor productivity, as in Figure 1, is misleading. For many commonly used production functions, in the absence of adjustment frictions, the distribution of the average revenue product of any factor will be degenerate. This is not the case in the Chinese data.
Approach
To confront these issues, our analysis adds a couple of elements to traditional trade models (see Note 3). First, labor adjustment costs play a central role in the analysis. The presence of adjustment costs limits redistribution from low to high productivity plants and thus generates differences in productivity across plants.
Second, in our model, the profits of an enterprise are impacted by demand shocks, both domestic and foreign, rather than productivity alone. This serves to limit the sorting by productivity. In particular, with these costs and shocks the model is able to match the distributions of productivity of exporters and non-exporting plants. Some exporting plants may not be very efficient but produce a valuable good in export markets. Thus some exporters appear less productive than a firm selling only to the domestic market.
Finally, the emphasis on average revenue labor productivity is replaced by a more comprehensive measure, termed profitability, that combines both demand and productivity shocks (see Note 4). In this way, a plant may not be very productive in terms of output per worker but may produce a high demand product and thus sell it in foreign markets.
Plants, regardless of ownership type, choose both labor inputs and trade status to maximize the expected discounted value of profits. These profits reflect revenues from both domestic and, if the plant is an exporter, foreign markets as well as the costs of adjusting the labor input and trade status.
The enhanced model is estimated through a simulated method of moments approach, where the moments come from Chinese manufacturing plants. With this procedure, the parameters are chosen so that the moments generated by the model match those in the data. The moments chosen for this exercise includes those that summarize trade as well as labor adjustment patterns. The distributions used to motivate the analysis, such as Figure 1, are not included as moments to match but are studied after the estimation.
Findings
The findings come from both the parameter estimation and additional exercises. Once the parameters are estimated a number of counterfactual exercises are presented to address the main question of the paper: what determines trade status?
a. Parameter Estimates
The model parameters are estimated by ownership, allowing for both labor adjustment and trade costs. While parameters for both frictions are statistically significant, the fit of the model is almost as close with labor adjustment costs alone, including matching trade moments. The adjustment costs are larger for the state owned enterprises and these plants are more patient, consistent with stories that SCE are able to borrow more easily than private enterprises.
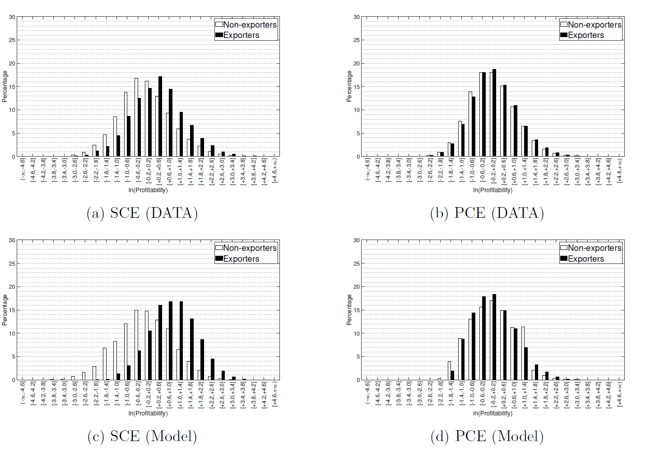
Figure 2: Revenue Based Profitability
b. Who are the exporters?
Current export status is largely determined by export status in the previous period, firm size, and revenue-based productivity (see Note 5). Being an exporter in the previous year makes it more likely a plant will be an exporter in the current year. The dynamic element of trade status reflects both the labor adjustment and the trade costs. Regardless of ownership type, larger plants are more likely to be exporters. Plants with higher levels of profitability are more likely to be exporters. The response of export status to the profitability innovation differs by ownership, with the SCE export status being more responsive to profitability shocks than the PCE. The labor adjustment costs influence the response of export status to changes in the profitability of an enterprise.
c. Distributions of Profitability
Figure 2 shows the distributions of a revenue-based measure of profitability, by ownership and export status, in the model and the data. Though this measure is exogenous, in contrast to the average productivity of labor, there is still considerable overlap in the exporter and non-exporter distributions.
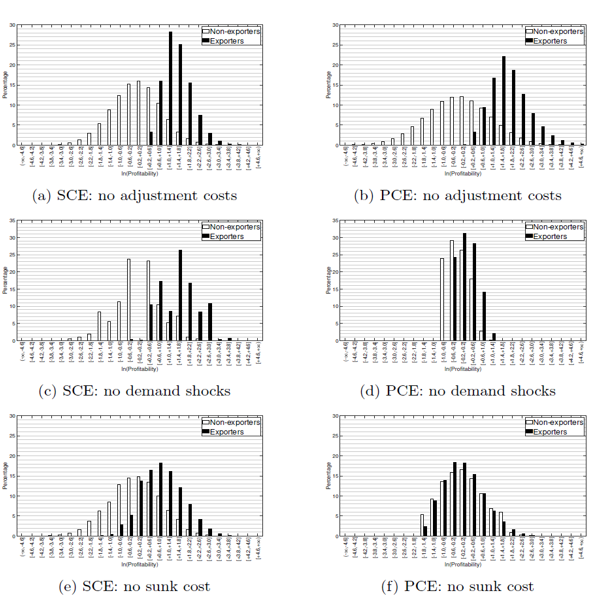
The analysis determines the factors that generate this overlap. Figure 3 shows the distributions of a revenue-based measure of profitability, by ownership and export status, in the model under three counterfactual experiments: removing adjustment costs, only technology shocks and removing the sunk cost.
For both ownership groups, removing the labor adjustment costs implies that sorting is much closer to the basic theory prediction, with little overlap in the profitability distribution by export status. The adjustment costs impact selection since a plant with high productivity but few workers, cannot quickly expand and begin to export. In this way, these costs substitute for sunk export costs.
The sorting is not as clean in the absence of demand shocks though again the exporters are surely among the highest plants in terms of profitability. From the bottom row of Figure 3, removing the sunk costs results in almost no change in the overlap in both cases.
Figure 3: Experiments
Note 1: Data are from China trade statistics released by World Bank: https://wits.worldbank.org/CountryProfile/en/CHN.
Note 2: Our motivation is similar to that of Bernard, Eaton, Jensen, and Kortum (2003), but our approach is quite different.
Note 3: Alessandria, Arkolakis, and Ruhl (2020) provides a comprehensive review of dynamic trade models and evidence. Sunk costs play a central role in their analysis, following Melitz (2003)., but labor adjustment costs are missing.
Note 4: More details about this measure, the estimation and the counterfactuals are reported in our working paper, Cooper, Gong, Hu and Yan (2020).
Note 5: Revenue-based productivity is defined as a measure of profitability, containing both technology and demand shocks, as this summarizes the return to employment and exporting.
(Russell Cooper, Department of Economics, European University Institute; Department of Economics, Pennsylvania State University; Research Associate, NBER; Guan Gong, School of Economics, Shanghai University of Finance and Economics; Guanliang Hu, Department of Economics, Pennsylvania State University; Ping Yan, CCER, National School of Development, Peking University.)
References
Alessandria, G. A., C. Arkolakis, and K. J. Ruhl (2020): “Firm dynamics and trade,” NBER Working Paper, #27934.
Bernard, A. B., J. Eaton, J. B. Jensen, and S. Kortum (2003): “Plants and productivity in international trade,” American Economic Review, 93(4), 1268-1290.
Cooper, R., G. Gong, and P. Yan (2015): “Dynamic Labor Demand in China: public and private objectives,” Rand Journal of Economics, 46(3), 577-610.
Cooper, R., G. Gong, G. Hu and P. Yan (2020): “Exporting From China: The Determinants of Trade Status,” NBER Working Paper #28289.
Melitz, M. J. (2003): “The impact of trade on intra-industry reallocations and aggregate industry productivity,” Econometrica, 71(6), 1695-1725.
Ruhl, K. J., and J. L. Willis (2017): “New exporter dynamics,” International Economic Review, 58(3), 703-726.

Latest
Most Popular
- VoxChina Covid-19 Forum (Second Edition): China’s Post-Lockdown Economic Recovery VoxChina, Apr 18, 2020
- China’s Great Housing Boom Kaiji Chen, Yi Wen, Oct 11, 2017
- China’s Joint Venture Policy and the International Transfer of Technology Kun Jiang, Wolfgang Keller, Larry D. Qiu, William Ridley, Feb 06, 2019
- The Dark Side of the Chinese Fiscal Stimulus: Evidence from Local Government Debt Yi Huang, Marco Pagano, Ugo Panizza, Jun 28, 2017
- Wealth Redistribution in the Chinese Stock Market: the Role of Bubbles and Crashes Li An, Jiangze Bian, Dong Lou, Donghui Shi, Jul 01, 2020
- Evaluating Risk across Chinese Housing Markets Yongheng Deng, Joseph Gyourko, Jing Wu, Aug 02, 2017
- What Is Special about China’s Housing Boom? Edward L. Glaeser, Wei Huang, Yueran Ma, Andrei Shleifer, Jun 20, 2017
- Privatization and Productivity in China Yuyu Chen, Mitsuru Igami, Masayuki Sawada, Mo Xiao, Jan 31, 2018
- Daily Price Limits and the Magnet Effect Ting Chen, Zhenyu Gao, Jibao He, Wenxi Jiang, Wei Xiong, Oct 25, 2017
- How did China Move Up the Global Value Chains? Hiau Looi Kee, Heiwai Tang, Aug 30, 2017


