A Bridge on Economic Issues between China and the World


 Facebook
  Twitter
  Instagram
 WeChat
  Email
Email Verifying China’s COVID-19 Recovery Using the FRBSF China CAT

Using the FRBSF China Cyclical Activity Tracker, we confirm the robustness of China’s recovery from the COVID-19 downturn. The FRBSF “China CAT” estimates that first quarter 2020 China GDP plunged 6.4 standard deviations below its detrended level a year earlier, but by the end of the third quarter, China economic activity had recovered to only 0.1 standard deviations below trend. As such, the FRBSF China CAT index validates the accuracy of the economic recovery from the COVID-19 pandemic reported in Chinese GDP figures.

As China was the first to suffer the adverse economic consequences of the COVID-19 pandemic, it is not surprising that the country was also one of the first to experience recovery from the crisis. Still, the announced pace of China’s recovery from the crisis has been notable. As reported, real gross domestic product (GDP) plunged 6.8% in the first quarter of 2020 from a year earlier. But reported GDP rose by 3.2% growth in the second quarter and by 4.8% in the third quarter (both figures are compared with the year-earlier period). Is the speed of this rebound plausible?
Introduction
A number of studies have raised concerns about the accuracy of China’s GDP data. For example, Nakamura, et al (2016) find that official aggregate consumption data are too smooth relative to expected levels based on standard theory. Pinovsky and Sala-i-Martin (2016) find that China’s reported GDP growth rate appears to be exceptionally high relative to its growth in light emissions, as measured from satellite data. Chen, Chen, Hsieh and Song (2019) use both value-added tax data and local indicators less conducive to manipulation. They estimate that GDP growth from 2010-2016 was 1.8 percentage points lower than reported.
In a recent paper, Fernald, Hsu, and Spiegel (2020) revisit the accuracy of Chinese statistics using indices of economic activity created as weighted averages of data on a broad range of measures of economic activity in China. The statistical technique that creates these weighted averages, known as principal components (PC), provides an index that captures as much of the variability as possible in the individual series. Conceptually, this index is similar to the Chicago Fed National Activity Index (see, e.g., Brave 2008) for the United States.
We use our preferred indices to examine the post-COVID-19 rebound in economic activity.
The FRBSF China Cyclical Activity Tracker (China CAT)
One challenge that arises in generating such an index is the very large number of possible combinations of indicators of activity from which to choose. Individual indicators, such as electricity use or fixed asset investment, are all produced within China, so they could all themselves be subject to manipulation or statistical error.
In Fernald, Hsu, and Spiegel (2020), we propose that the relationship with China’s real imports—as measured by trading-partner exports—provides external validation. Trading-partner exports are measured outside of China—and so this measure of imports is not subject to manipulation or statistical error by Chinese authorities. Of course, imports represent only one part of the economy, focused on goods. Nevertheless, we find that, for countries with good statistical systems, imports and GDP co-move closely. (We stop these comparisons prior to the recent trade war and disruptions.)
Our preferred China “cyclical activity tracker” (China CAT) is based on eight non-GDP indicators—a broader set than was famously used by Premier Li (Wikileaks, 2007). The indicators in the China CAT comprise a consumer expectations index, electricity, exports, fixed asset investment, floor space, industrial production, rail freight, and retail sales.
The China CAT represents deviations in year-over-year growth from trend. Intuitively, because the data series have different trends, if we did not detrend the index would be a mix of cyclical effects and the differential trends. Stock and Watson (2016) recommend removing low-frequency trends from the growth rates to avoid misspecification. (The index is thus best suited to assessing cyclical volatility, not systematic bias.) The series is updated quarterly, with the data and additional documentation available on the Federal Reserve Bank of San Francisco web site.
Figure 1. Official China GDP, China CAT, and All Indicators index
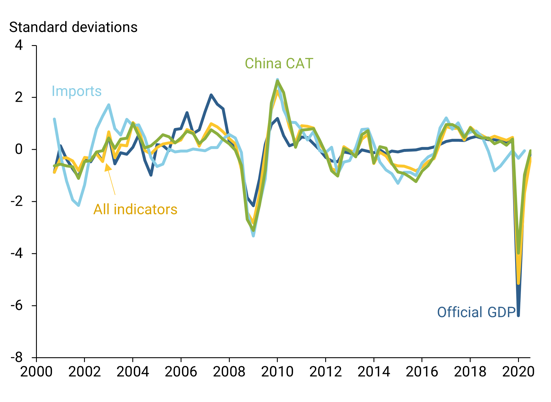
The thick green line in Figure 1 shows the China CAT index. We also track an “all indicators” index (gold line) using the first principal components of a broader set of 14 indicators. The similarity of the China CAT and all-indicators indices shows that results are not sensitive to the exact combination of individual indicators chosen. The dark blue line shows China’s official GDP data (dark blue line). Finally, the light blue line shows trading-partner data on China’s imports. The series all move relatively closely together, though GDP is the most different. Perhaps most strikingly, official China GDP figures appear excessively smooth from about 2013 until the arrival of COVID-19 in 2020.
Verifying China’s Recovery
Figure 2. China’s Recovery from the COVID-19 Crisis
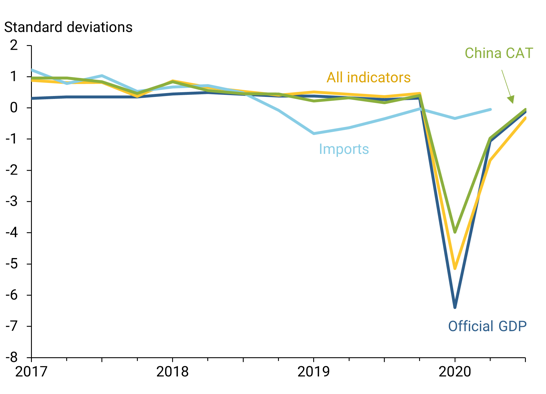
Figure 2 focuses on data since 2017, illustrating the COVID downturn and subsequent recovery up to Q3 2020. Because the China CAT is detrended, we measure its values as the number of standard deviations of year over-year growth from trend. Hence, by construction, the series has an average of zero and a standard deviation of one. Other recent updates to the China CAT series for 2020 are summarized in an FRBSF blog.
When we convert reported GDP into similar units, first-quarter GDP growth plunged 6.4 standard deviations below its detrended year-earlier level. By the third quarter, the pace of GDP growth had largely recovered, at only 0.1 standard deviations below trend. That value corresponds to the reported 4.8% third-quarter GDP growth.
Detrended values from the China CAT are qualitatively similar to the official reports—indeed, our results are a bit less negative than official data. The China CAT shows a first-quarter decline of 4.0 standard deviations below trend, with a rebound to only 0.05 standard deviation below trend in the third quarter. Five of the eight individual indicators remained negative (below trend) in the third quarter, but the most negative—the consumer index—was only 1.0 standard deviations below trend. Exports, industrial production, and electricity were all very modestly above trend. We note that the broader “all indicators” index fell a little more than the China CAT in the first quarter, by 5.1 standard deviations. The all-indicators index also rebounded somewhat less, recovering to a year over-year decline of 0.3 standard deviations. We view these numbers as being roughly consistent qualitatively with both the China CAT and reported GDP.
Conclusion
Our updated China CAT index does not suggest any sizeable systematic bias in officially reported Chinese output numbers. Moreover, while official data appeared to be “excessively smooth” relative to the China CAT over recent years (Figure 1), this is not the case so far in 2020. China’s GDP data for the first two quarters of 2020 show even greater movement than those we calculated with the China CAT. Overall, our results confirm the accuracy of the economic recovery from the COVID-19 pandemic reported in Chinese GDP figures.
(Remy Beauregard is a research associate in the Economic Research Department of the Federal Reserve Bank of San Francisco; John G. Fernald is a senior research advisor in the Economic Research Department of the Federal Reserve Bank of San Francisco and professor of economics at INSEAD; Mark M. Spiegel is a senior policy advisor in the Economic Research Department of the Federal Reserve Bank of San Francisco.)
References
Brave, Scott (2008). “Economic trends and the Chicago Fed National Activity Index.” Chicago Fed Letter No. 250, May.
Chen, Wei, Xilu Chen, Chang-Tai Hsieh and Zheng Song, (2019), “A Forensic Examination of China’s National Accounts, NBER Working Paper No. 25754, April.
Fernald, John G., Eric Hsu, and Mark M. Spiegel. 2020. “Is China Fudging Its GDP Figures? Evidence from Trading Partner Data.” Forthcoming in Journal of International Money and Finance.
Nakamura, Emi, Jon Steinsson, and Miao Liu, (2016), “Are Chinese Growth and Inflation Too Smooth?: Evidence from Engel Curves,” American Economic Journal: Macroeconomics. 8(3): 113–144.
Pinovsky, Maxim and Xavier Sala-i-Martin (2016). “Lights, Camera, … Income! Illuminating the National Accounts-Household Surveys Debate.” The Quarterly Journal of Economics, 131 (2): 579-631, May.
Stock, James H., and Mark W. Watson, (2016), “Dynamic Factor Models, Factor Augmented Vector Autoregressions, and Structural Vector Autoregressions in Macroeconomics.” In Handbook of Macroeconomics, Volume 2A, edited by John B. Taylor and Harald Uhlig. Amsterdam: North-Holland.
Wikileaks (2007). http://wikileaks.org/cable/2007/03/07BEIJING1760.html.

Latest
Most Popular
- VoxChina Covid-19 Forum (Second Edition): China’s Post-Lockdown Economic Recovery VoxChina, Apr 18, 2020
- China’s Great Housing Boom Kaiji Chen, Yi Wen, Oct 11, 2017
- China’s Joint Venture Policy and the International Transfer of Technology Kun Jiang, Wolfgang Keller, Larry D. Qiu, William Ridley, Feb 06, 2019
- The Dark Side of the Chinese Fiscal Stimulus: Evidence from Local Government Debt Yi Huang, Marco Pagano, Ugo Panizza, Jun 28, 2017
- Wealth Redistribution in the Chinese Stock Market: the Role of Bubbles and Crashes Li An, Jiangze Bian, Dong Lou, Donghui Shi, Jul 01, 2020
- Evaluating Risk across Chinese Housing Markets Yongheng Deng, Joseph Gyourko, Jing Wu, Aug 02, 2017
- What Is Special about China’s Housing Boom? Edward L. Glaeser, Wei Huang, Yueran Ma, Andrei Shleifer, Jun 20, 2017
- Privatization and Productivity in China Yuyu Chen, Mitsuru Igami, Masayuki Sawada, Mo Xiao, Jan 31, 2018
- How did China Move Up the Global Value Chains? Hiau Looi Kee, Heiwai Tang, Aug 30, 2017
- China’s Shadow Banking Sector: Wealth Management Products and Issuing Banks Viral V. Acharya, Jun Qian, Zhishu Yang, Aug 09, 2017


