A Bridge on Economic Issues between China and the World


 Facebook
  Twitter
  Instagram
 WeChat
  Email
Email Long-run Trends in China’s Urban Unemployment and Labor Force Participation

Official unemployment rate in China is based on registered unemployment figures, but the official figures are likely underestimates of the true unemployment rates because many unemployed people are not qualified to register with government agencies and even those who are qualified may choose not to for various reasons. Shuaizhang Feng of Jinan University, and Yingyao Hu and Robert Moffitt, both of Johns Hopkins University, discuss their new effort to provide the first comprehensive picture of China’s labor market for the period 1988-2009 using Urban Household Survey (UHS) data administered by the National Bureau of Statistics of China.
According to the official figures, China’s unemployment rate has been very low compared to other countries at similar stages of economic development and suspiciously stable over time (see dashed line in Figure 1). This is perhaps not surprising — the official unemployment rate in China is based on registered unemployment figures. Many unemployed people are not qualified to register with government agencies and even those who are qualified may choose not to for various reasons, the most important one being the very low levels of unemployment benefits.
Various previous studies have tried to make better estimates, and have usually ended up with numbers significantly higher than the official ones. In most cases those studies simply add laid-off workers to the registered unemployed to derive a total unemployment figure. This method is unsatisfactory as many officially laid-off or registered unemployed workers may actually be working part- or full-time or may be out of the labor force, and the underlying administrative labor statistics are also unreliable. Some studies use micro-level data, but typically such data have been available for only selected regions and for only a few years, as in Giles et al. (2005) and Liu (2012).
Our recent study (Feng, Hu, and Moffitt, 2017) provides the first comprehensive picture of China’s labor market for the period 1988-2009. We use Urban Household Survey (UHS) data administered by the National Bureau of Statistics of China. The UHS sample is representative of all registered urban residents— the "Hukou" population, which we further adjust using weights derived from the decennial Census data. The UHS records fifteen categories for “employment status” for each individual, allowing us to classify one's labor force status into either employed, unemployed, or not-in-labor-force. These categorizations are consistent over time, and largely concur with the International Labor Organization (ILO) definitions adopted in 1982 for internationally consistent unemployment rate comparisons.
Overall, our UHS unemployment rate series is significantly higher than the official series (see solid line in Figure 1). While the UHS unemployment rate was only somewhat above the official series from 1988 to the mid-1990s, it rose dramatically shortly thereafter. In fact, we find that by approximately 2000, the unemployment rate in China was actually higher than that of high-income countries, exactly the opposite of what is implied by the official series. Nevertheless, direct international comparisons are always tricky, as China’s Urban Household Survey data do not define labor-force status in exactly the same way as many developed countries.
Figure 1: Unemployment Rates by Country
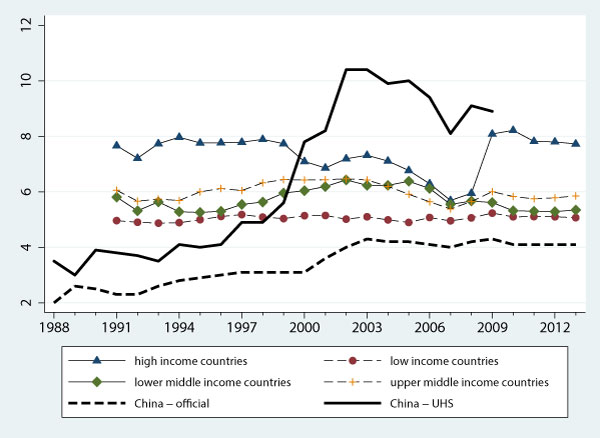
We break the 1988-2009 period into three sub-periods based on the stages of China's labor market development: the state-owned enterprises (SOE) period (1988-1995), the labor market reform period (1995-2002) and the post-reform period (2002-2009). According to our calculations, in the first period, the average estimate of the unemployment rate was only 3.7%, while the official average was 2.5%. During this time period, the urban labor market was still characterized by the so-called “iron rice bowl,” with state-assigned jobs and lifetime employment, mainly in the state sector. However, in 1995–2002, the UHS-based unemployment rate jumped to an average of 6.2%, far above the official estimate, and climbed rapidly during the period, gaining almost one percentage point each year. The dramatic rise in unemployment coincided with a period of mass layoffs from SOEs and acceleration in rural-to-urban migration.
The rising trend of unemployment stopped in approximately 2002, partly as a result of China’s entry in the World Trade Organization, which increased the demand for labor, and partly as a result of a major expansion of college enrollment, which improved the overall quality of labor. Nevertheless, the unemployment rate seems to have reached a new equilibrium level far higher than what the official figures suggest. In the 2002–2009 period, the UHS-based unemployment rate averaged 9.5%. The official rate lagged far behind at an average of only 4.2%, or less than half of the UHS-based rate.
Demographic shifts over the period actually dampened the increase in the unemployment rate. When demographic composition is held fixed, the unemployment rate was even higher. We also find that the increases in aggregate unemployment fell most heavily on the less educated, younger, and female portion of the population. In addition, regions with more SOE layoffs also experienced more increases in unemployment since the mid-1990s.
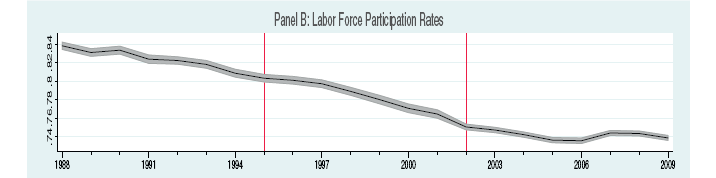
Labor force participation rate has been declining since the late 1980s
Besides unemployment, one has to understand changes in labor force participation to gain a full understanding of the evolution of the urban labor market. The Chinese government does not release official labor force participation rates. Based on our calculations using the Urban Household Survey, we find participation declined throughout the whole period (Figure 2). It dropped from an average of 82.2% in the first period to 78.2% in the second period, and again dropped, to 74.2%, in the third period. Declines in labor-force participation often accompany increases in the unemployment rate as individuals become discouraged and withdraw from the labor force because of the difficulty of finding a job.
What if we include all urban residents?
UHS only covers urban residents with local Hukou, but residents without Hukou, e.g., urban migrants, are increasingly important in China’s labor markets. Using the decennial Census data and extrapolating to other off-Census years, we show in Panel A of Figure 3 that the migrant population has been the main source of increase for all urban residents and has surpassed the local-urban-Hukou population in number since around 2004. To consider migrants who reside in cities but do not hold local urban Hukou, we have to go beyond UHS data and use supplemental information from the decennial Census.
All Urban Residents
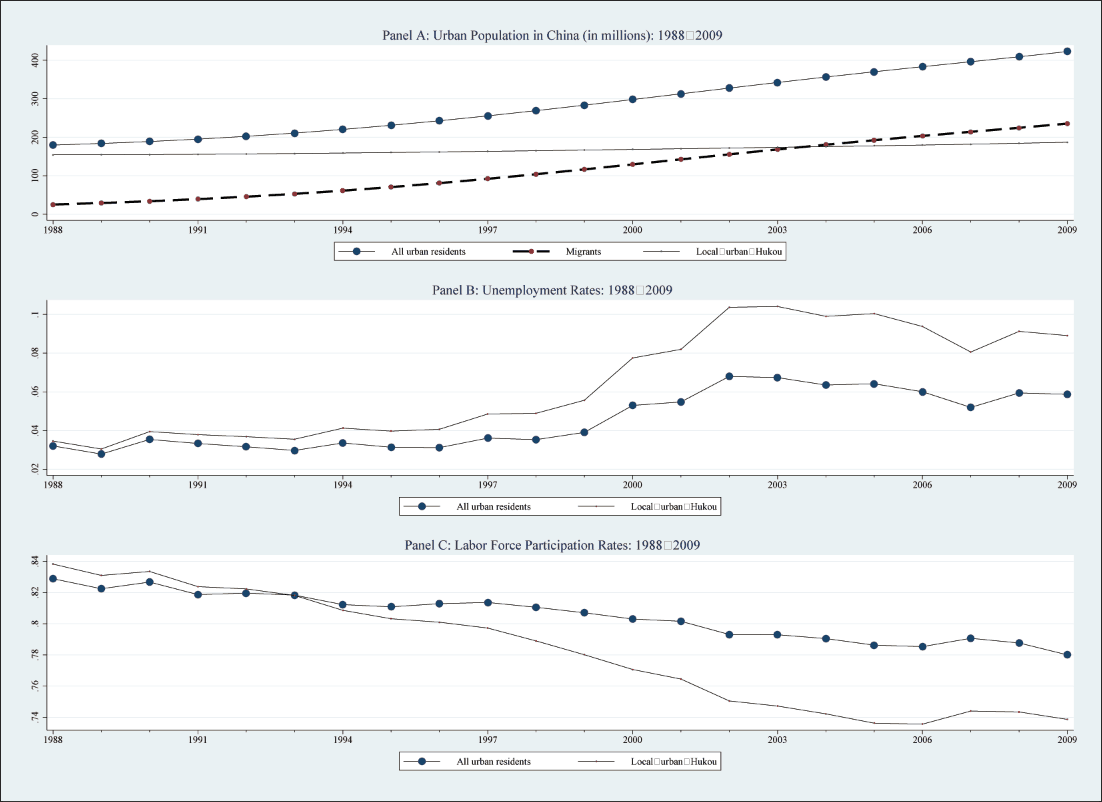
The results are graphically illustrated in the last two panels of Figure 3. The net effect of including migrants in the sample is to lower the unemployment rate and to raise the labor force participation rate. This is not surprising given that the majority of migrants come to cities for work, and they would return to their rural home if there were no job opportunities in cities. As for the time pattern, although the migrant share has gradually increased over time, the general trend is very similar to our baseline results with only local-urban-Hukou people. For the post-2000 period, where estimates peak, our estimates for the unemployment rate for all urban population lie between 5% and 7%, which are in line with the range for upper-middle-income countries similar to China (see Figure 1). The labor force participation rates range between 78% and 80% in that same period.
(Shuaizhang Feng, Institute for Economic and Social Research, Jinan University; Yingyao Hu, Krieger School of Arts & Sciences, Johns Hopkins University; Robert Moffitt, Krieger School of Arts & Sciences, Johns Hopkins University.)
Cai, F., Park, A. , Zhao, Y., 2008. The Chinese labor market in the reform era. In: Brandt, L., Rawski, T.G. (Eds.), China’s Great Economic Transformation. Cambridge University Press.
Feng, S., Hu, Y., Moffitt, R., 2017. Long Run Trends in Unemployment and Labor Force Participation in China. Forthcoming in Journal of Comparative Economics.
https://www.sciencedirect.com/science/article/pii/S0147596717300227
Giles, J., Park, A., Zhang, J., 2005. What is China’s true unemployment rate? China Economic Review. 16, 149–170.
Giles, J., Park, A., Cai, F., 2006. How has economic restructuring affected China’s urban workers? China Quarterly, 185, 61–95.
Liu, Q., 2012. Unemployment and labor force participation in urban China. China Economic Review, 23, 18–33.

Latest
Most Popular
- VoxChina Covid-19 Forum (Second Edition): China’s Post-Lockdown Economic Recovery VoxChina, Apr 18, 2020
- China’s Great Housing Boom Kaiji Chen, Yi Wen, Oct 11, 2017
- China’s Joint Venture Policy and the International Transfer of Technology Kun Jiang, Wolfgang Keller, Larry D. Qiu, William Ridley, Feb 06, 2019
- The Dark Side of the Chinese Fiscal Stimulus: Evidence from Local Government Debt Yi Huang, Marco Pagano, Ugo Panizza, Jun 28, 2017
- Wealth Redistribution in the Chinese Stock Market: the Role of Bubbles and Crashes Li An, Jiangze Bian, Dong Lou, Donghui Shi, Jul 01, 2020
- Evaluating Risk across Chinese Housing Markets Yongheng Deng, Joseph Gyourko, Jing Wu, Aug 02, 2017
- What Is Special about China’s Housing Boom? Edward L. Glaeser, Wei Huang, Yueran Ma, Andrei Shleifer, Jun 20, 2017
- Privatization and Productivity in China Yuyu Chen, Mitsuru Igami, Masayuki Sawada, Mo Xiao, Jan 31, 2018
- How did China Move Up the Global Value Chains? Hiau Looi Kee, Heiwai Tang, Aug 30, 2017
- China’s Shadow Banking Sector: Wealth Management Products and Issuing Banks Viral V. Acharya, Jun Qian, Zhishu Yang, Aug 09, 2017


