A Bridge on Economic Issues between China and the World


 Facebook
  Twitter
  Instagram
 WeChat
  Email
Email The US-China Trade War Is Based on Misleading Statistics

General Motors and Apple sold more cars and iPhones in China than in the US, but their sales were not counted as US exports to China, as these were made and sold in China. Policymakers should look at both trade and local sales by foreign firms (the FDI channel) to gauge bilateral economic balance. We estimate that US firms sold more goods and services to China than Chinese firms sold to the US in 2017, once the FDI channel is taken into account.
The trade war between China and the US is a major macro risk to the global economy. So far the policy debate between the two countries has focused on the bilateral trade balance, which shows a large and rising deficit on the US side, at $375 billion in 2017. But is trade balance the right focus? In a globalized economy, firms often localize their production and distribution in other countries—that is, through the foreign direct investment (FDI) channel rather than the trade channel. The trade balance may give a misleading picture if the FDI channel is neglected.
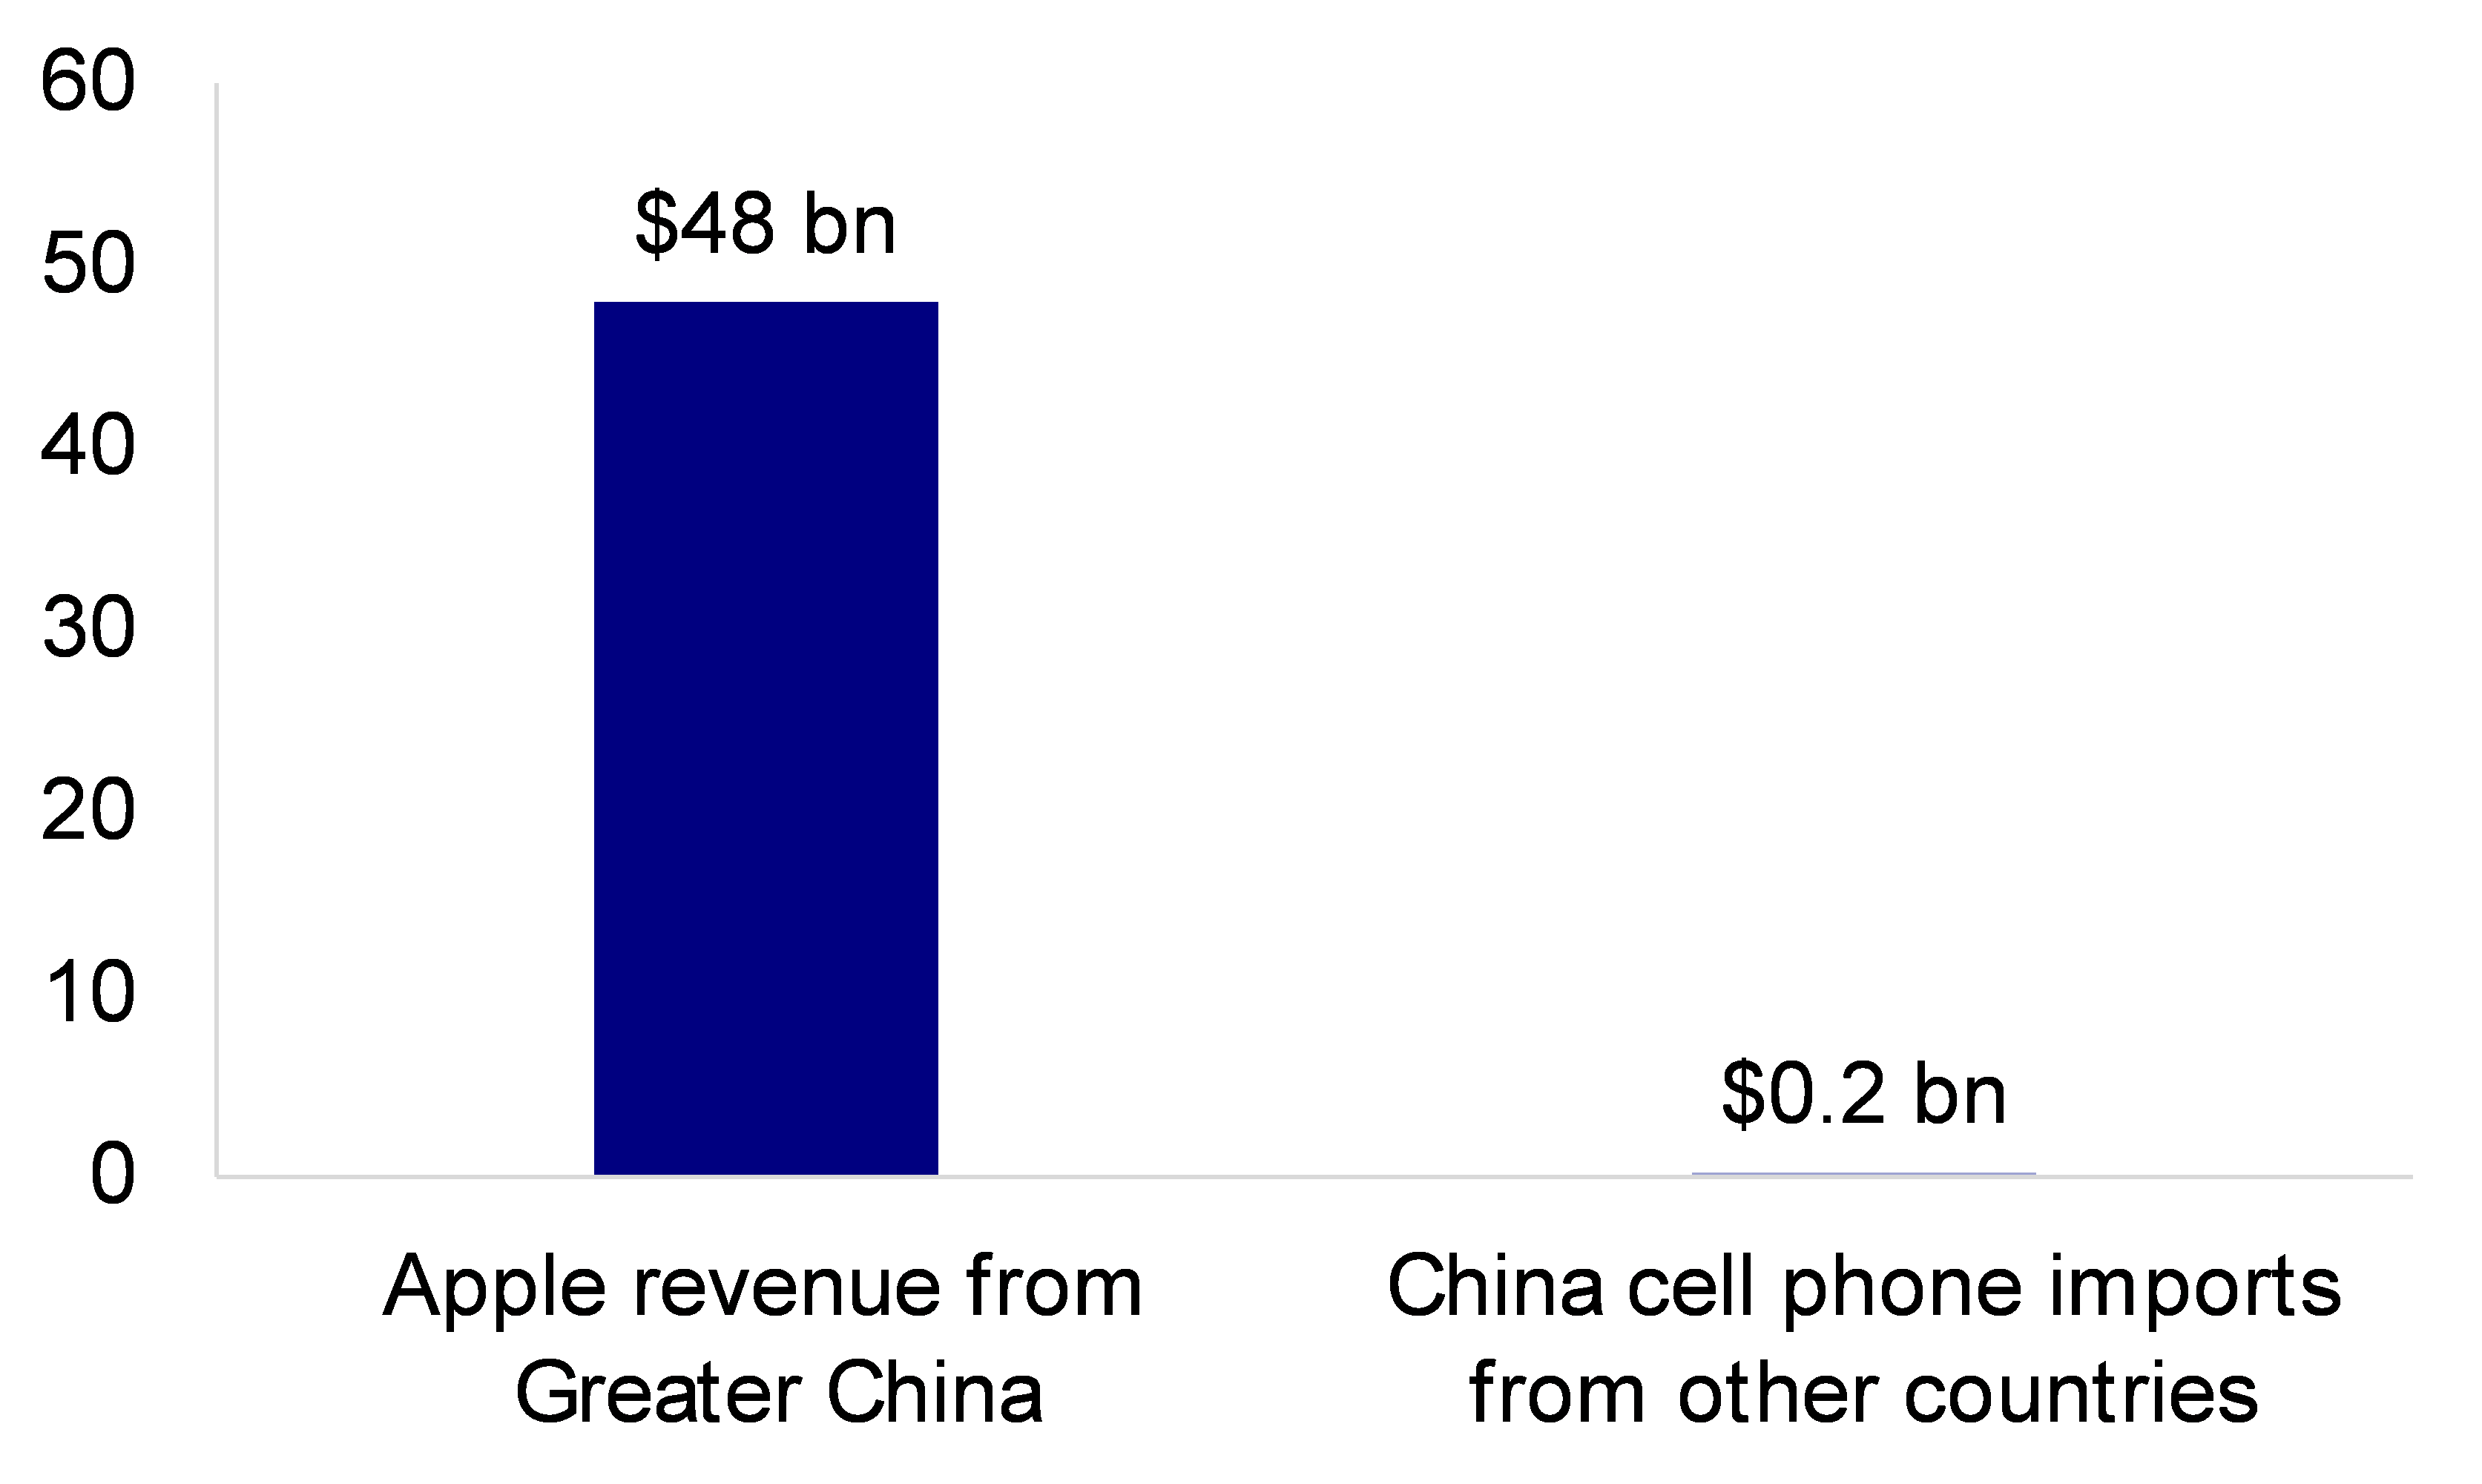
Apple’s iPhone is a good example to make this point. There were 310 million active iPhones running in China in 2016, according to a report by Internet Society of China. One out of six smartphone users in China is an iPhone user. Apple generated $48 billion in revenue from China in 2016, mostly from the sale of iPhones. But these iPhones cannot be found in US-China bilateral trade. China imported only $1 million of cell phones from the US ($250 million from all other countries) in 2016, according to trade statistics—a negligible number compared to iPhone sales (Figure 1). At the same time, China exports $26 billion of cell phones to the US. In other words, the US has a $26 billion trade deficit to China on cell phones, despite the facts that iPhones can be seen everywhere in China and Chinese brand smartphones are rarely found in the US.
Source: Deutsche Bank, Bloomberg Finance LP, UN COMTRADE, WITS
How did this happen? Apple, like many other US companies, has set up subsidiaries to operate in China. Various parts of each iPhone are imported to China from Apple’s global suppliers. iPhones are then assembled and sold in China without crossing the border. From an international trade perspective, iPhones sold by Apple’s Chinese subsidiaries are not counted as imports. But from an economic and financial perspective, iPhone is a US product, and the US benefits the most from it. A study conducted a few years back found that $334 out of each iPhone sold at $549 went to the US (Kraemer and others, 2011). The remainder is distributed among various suppliers. Only $10 goes to China as labor costs.
The US Bureau of Economic Analysis (BEA) conducts regular surveys on US Multinational Enterprises (MNEs). US MNEs are asked to report key operation statistics of their foreign affiliates, such as sales and exports/imports. We estimate the size of US business interests in China, using data from the US BEA survey. The total sales by US firms in China were $372 billion in 2015, including $223 billion through their subsidiaries in China and $150 billion through US exports to China. The sales earned by US subsidiaries in China included $171 billion of manufactured goods and $51 billion of services.
The same set of data from the US shows that Chinese firms sold $402 billion of goods and services to the US in 2015: $10 billion through Chinese subsidiaries in the US and $393 billion through exports. This suggests a net balance of -$30 billion from the US perspective in 2015. We define it as the "aggregate sales balance," which includes both trade balance (-$243 billion) and sales generated through subsidiaries, FDI operations in destination countries ($213 billion).
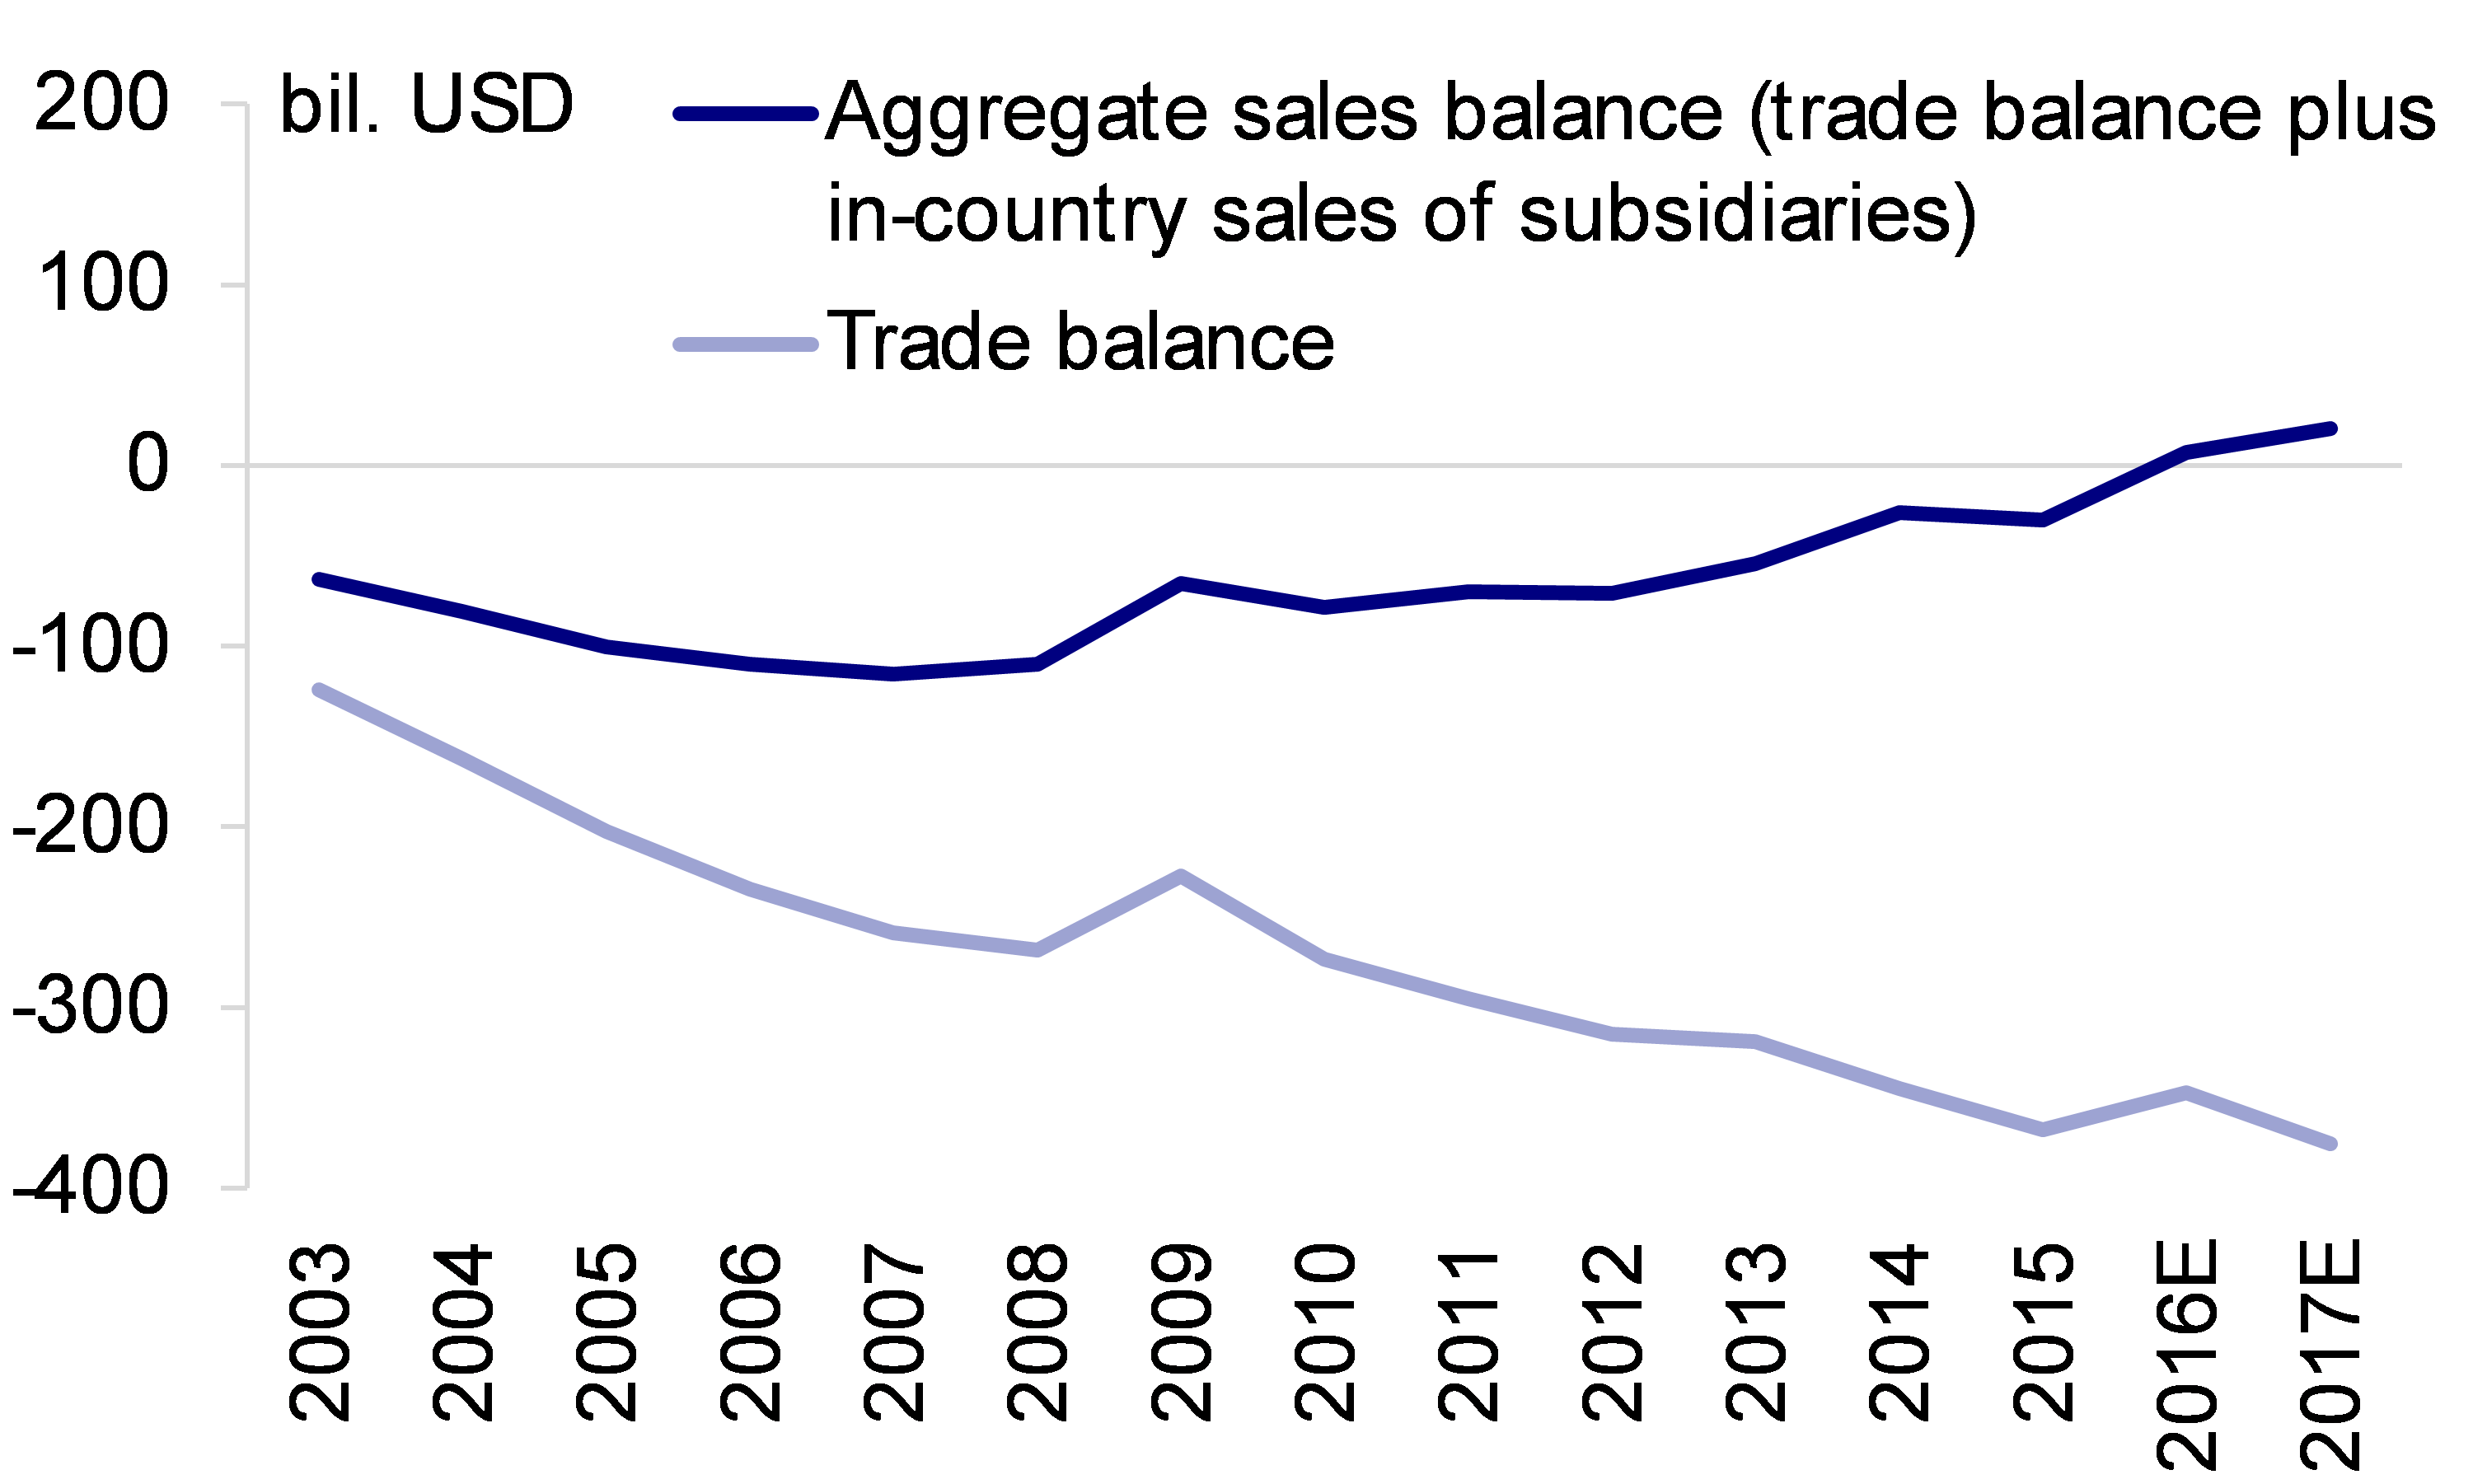
Interestingly, both the trade balance and the aggregate sales balance widened before 2009, but their trend has diverged since then. The trade balance continued to rise while the aggregate sales balance declined from -$110 billion in 2008 to -$30 billion in 2015. The surge of sales by US subsidiaries in China drove this decline: BEA data shows that China accounted for one-third of the incremental sales by US subsidiaries globally between 2010 and 2015.
The BEA survey is only available up to 2015. We used China sales data from US listed MNEs’ annual reports to update our estimates of the bilateral “aggregate sales balance” to 2017. We project that, from the US perspective, this balance has turned from a deficit of -$30 billion in 2015 to a surplus of $7 billion in 2016 and $20 billion in 2017 (Figure 2).
Source: Deutsche Bank, BEA, Bloomberg Finance LP, China Customs, IMF CDIS, WIND
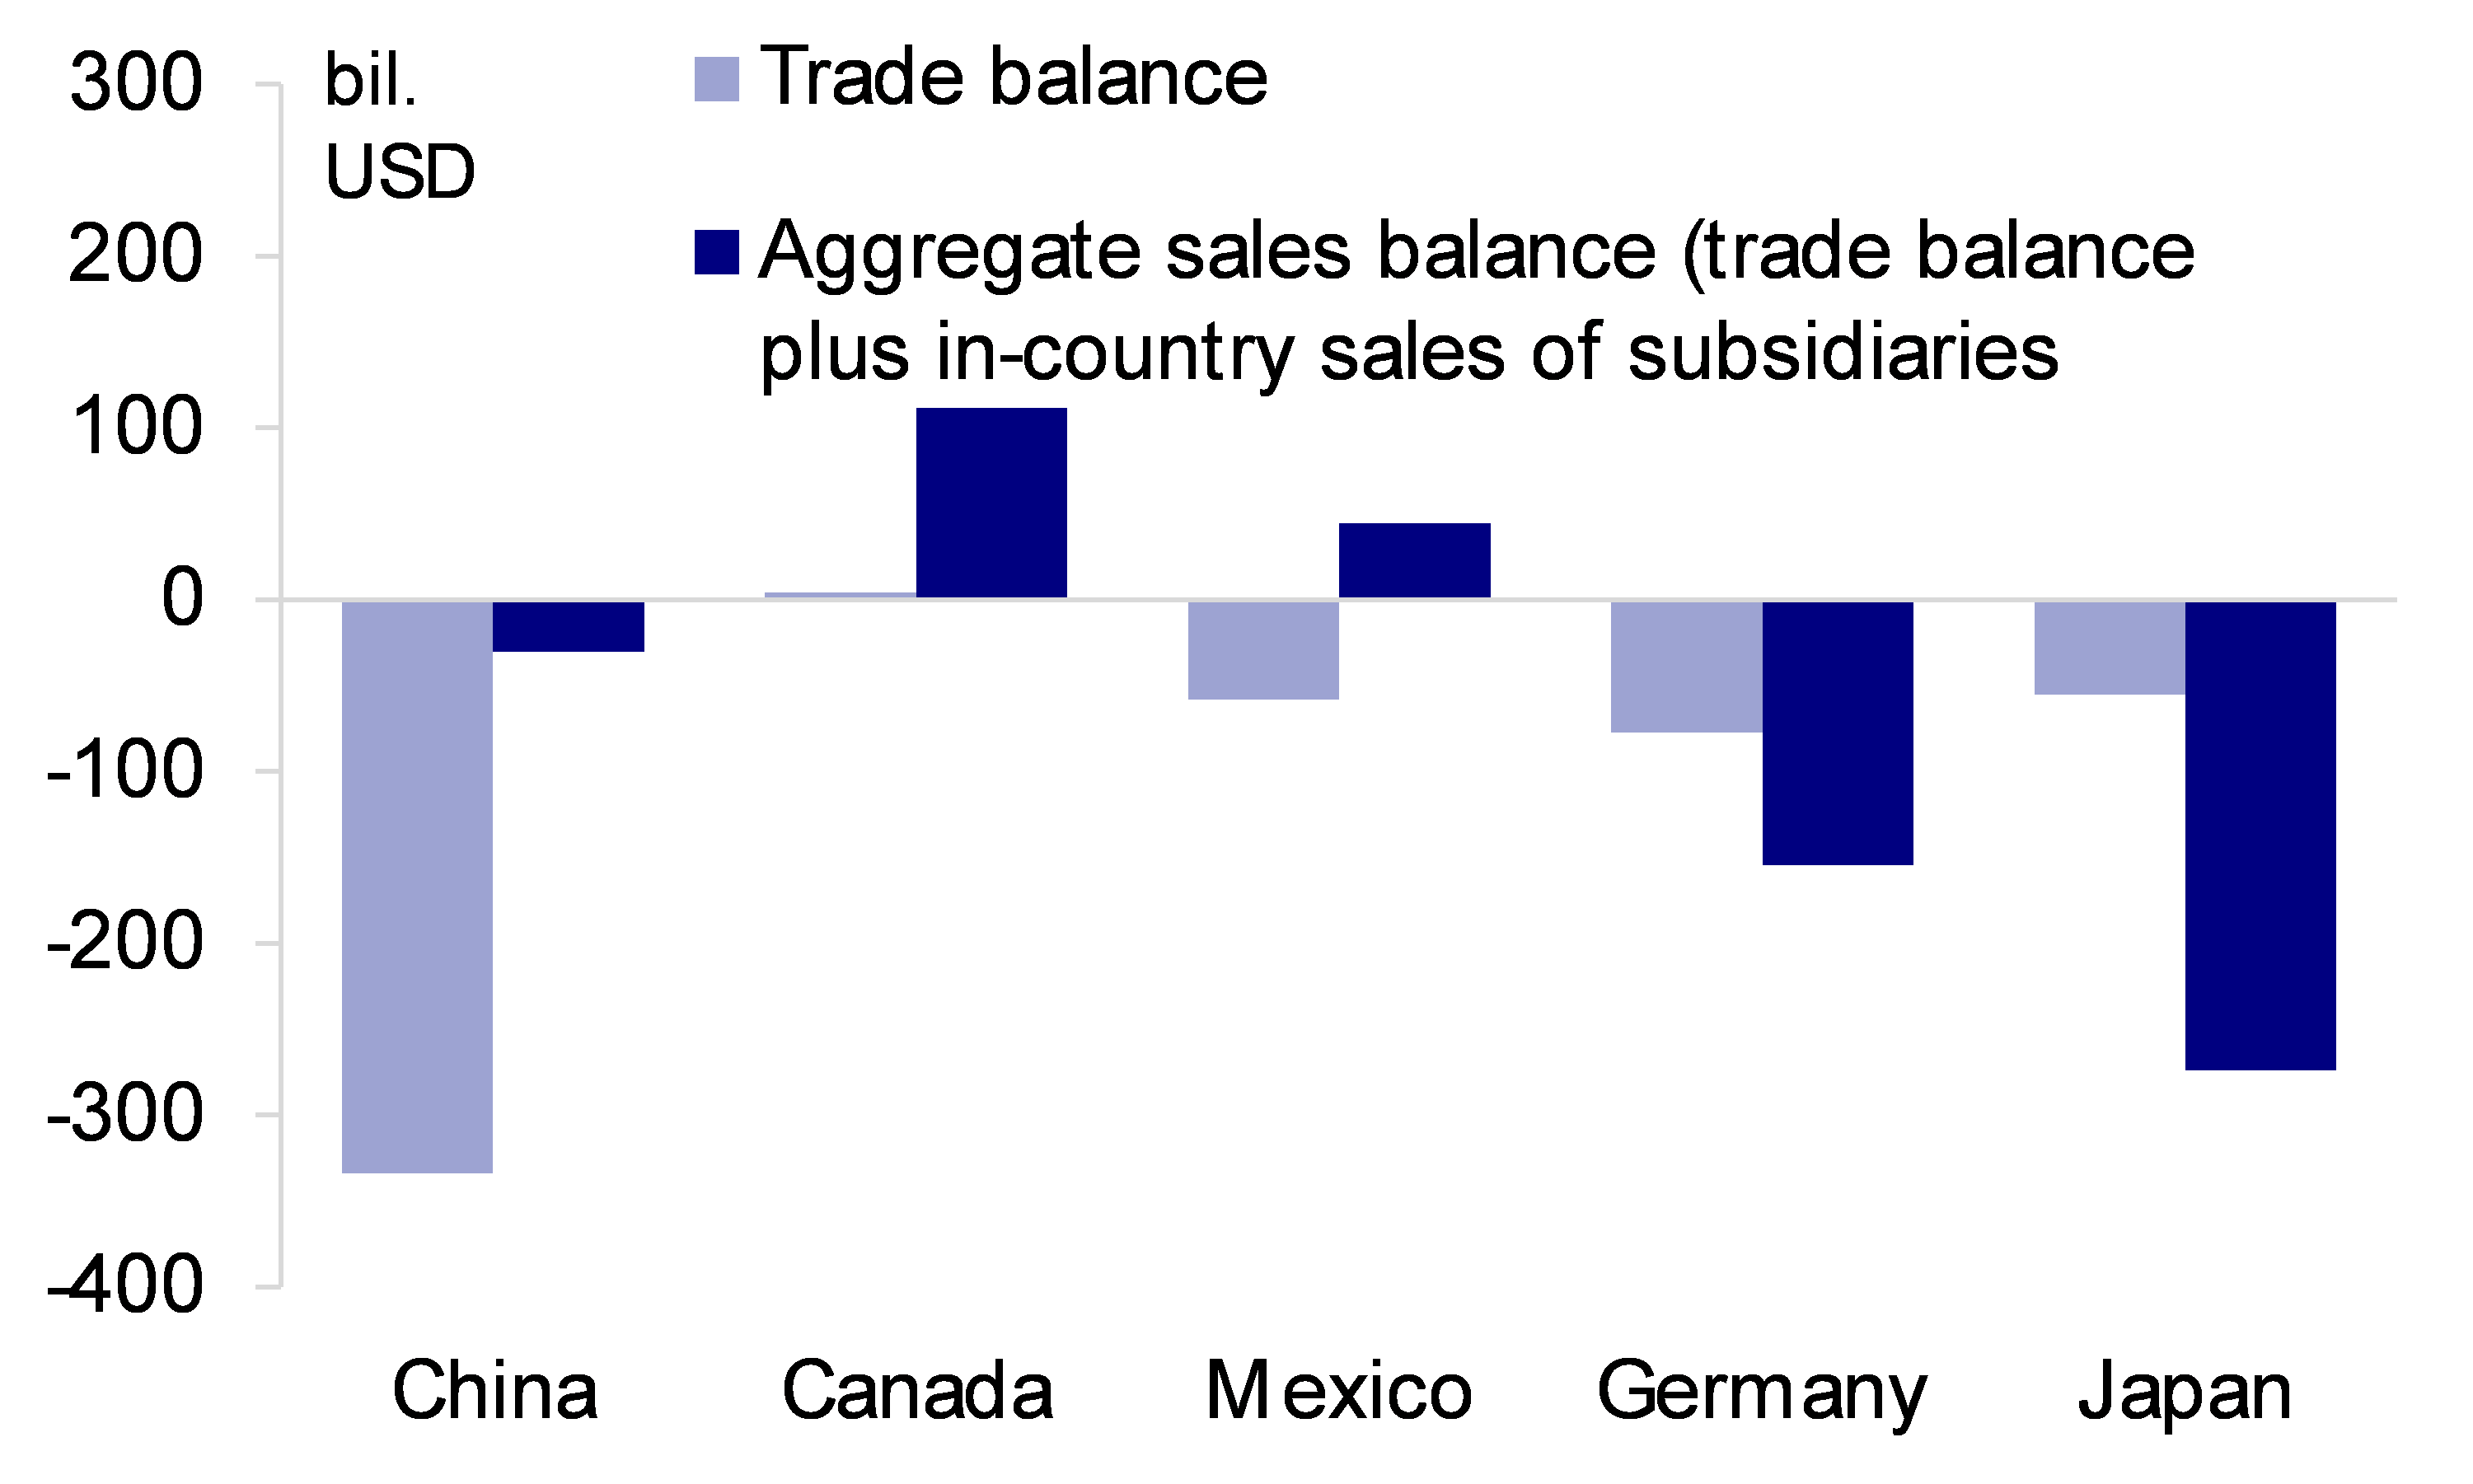
The BEA database also allows us to look at the bilateral balance between the US and other countries. Interestingly, Mexico exhibits a similar pattern to China. Mexico ran a bilateral trade surplus against the US, but a bilateral deficit against the US once US multinationals’ sales in Mexico were taken into consideration. Canada mirrors this trend, as well. In contrast, Japan and Germany ran a surplus against the US in both trade balance and the aggregate sales balance (Figure 3). These interesting bilateral balances reflect comparative advantages: US multinationals tend to localize their production only in countries with lower costs (China, Mexico, and Canada).
Source: Deutsche Bank, BEA, China Customs, IMF CDIS, WIND
A popular argument is that the US multinationals shifted jobs abroad. The truth may be quite the opposite. US multinationals are big domestic employers; their US parent companies employed 28 million people in 2015. This accounted for about a fifth of total US employment. Globally, US multinationals employed 45 million people in 2015, of which only 17 million worked for their foreign affiliates. More than 60% of workers were employed domestically. The share of domestic employment in MNEs has been quite stable in recent years.
Studies have shown that foreign affiliate activities tend to complement, not substitute for, parent company activities in the US (Slaughter, 2009). Many foreign subsidiaries are classified as operating in different businesses from their parent companies. Employment in foreign subsidiaries and in parent companies tends to move in the same direction (i.e., when subsidiaries increase employment, parent company employment also increases). One empirical study estimated that for each 10% increase in foreign employee compensation, domestic employee compensation increases by 3.7% (Desai and others, 2009).
This is not to say that globalization has no negative impacts on domestic employment. While the benefits of globalization are significant and widespread, foreign competition may disproportionately hurt some industries and geographic locations. Some researchers suggested that China’s unprecedented scale and rapid rise in global trade has created identifiable damage to US industries such as furniture, toys, and sporting goods (Autor and others, 2013). Labor market adjustment to this shock has been very slow in some areas, with wages depressed and unemployment elevated for a prolonged time (Autor and others, 2016).
But the negative impact is clearly not the full picture, and it seems to have phased out. The US currently has a tighter labor market than most other countries in the world. The unemployment rate is at its lowest level in decades. This suggests that the "China shock" to employment is not large and widespread. The US labor force as a whole still benefits from globalization; displacements from foreign competition are likely small and not widespread. The adjustment in the labor market may have been slow but it seems to have already completed on a macro level. Escalation of the trade war between the US and its major trading partners would be negative for US multinationals and the US labor market.
The best policy responses to help dislocated workers, as some have argued, involve providing better public services in affected regions and improving labor mobility (Senses, 2017). China’s rising demand for US products, such as food and energy, may also help some of the regions that have been negatively affected by globalization.
Autor, David, David Dorn, and Gordon H. Hansen (2013). “The China syndrome: Local labor market effects of import competition in the United States,” American Economic Review, 103(6), 2121-68.
Autor, David, David Dorn, and Gordon H. Hansen (2016). “The China Shock: Learning from labor-market adjustment to large changes in trade,” Annual Review of Economics, 8, 205-240.
Desai, Mihir. A, C. Fritz Foley, and James R. Hines Jr. (2009), “Domestic effects of the foreign activities of US multinationals,” American Economic Journal: Economic Policy, 1(1), 181-203.
Internet Society of China (2017), “China Mobile Internet Development and Security Report 2017,” http://www.isc.org.cn/zxzx/qt/listinfo-35398.html.
Kraemer, Kenneth L. , Greg Linden, and Jason Dedrick (2011), “Capturing Value in Global Networks: Apple’s iPad and iPhone,” University of California Irvine, http://pcic.merage.uci.edu/papers/2011/value_ipad_iphone.pdf.
Senses, Mine (2017), “Globalisation and US labour markets,” https://voxeu.org/article/globalisation-and-us-labour-markets, August 2017.
The trade war between China and the US is a major macro risk to the global economy. So far the policy debate between the two countries has focused on the bilateral trade balance, which shows a large and rising deficit on the US side, at $375 billion in 2017. But is trade balance the right focus? In a globalized economy, firms often localize their production and distribution in other countries—that is, through the foreign direct investment (FDI) channel rather than the trade channel. The trade balance may give a misleading picture if the FDI channel is neglected.
Apple’s iPhone is a good example to make this point. There were 310 million active iPhones running in China in 2016, according to a report by Internet Society of China. One out of six smartphone users in China is an iPhone user. Apple generated $48 billion in revenue from China in 2016, mostly from the sale of iPhones. But these iPhones cannot be found in US-China bilateral trade. China imported only $1 million of cell phones from the US ($250 million from all other countries) in 2016, according to trade statistics—a negligible number compared to iPhone sales (Figure 1). At the same time, China exports $26 billion of cell phones to the US. In other words, the US has a $26 billion trade deficit to China on cell phones, despite the facts that iPhones can be seen everywhere in China and Chinese brand smartphones are rarely found in the US.
Figure 1: Apple sales and China cellphone imports, 2016
How did this happen? Apple, like many other US companies, has set up subsidiaries to operate in China. Various parts of each iPhone are imported to China from Apple’s global suppliers. iPhones are then assembled and sold in China without crossing the border. From an international trade perspective, iPhones sold by Apple’s Chinese subsidiaries are not counted as imports. But from an economic and financial perspective, iPhone is a US product, and the US benefits the most from it. A study conducted a few years back found that $334 out of each iPhone sold at $549 went to the US (Kraemer and others, 2011). The remainder is distributed among various suppliers. Only $10 goes to China as labor costs.
The US Bureau of Economic Analysis (BEA) conducts regular surveys on US Multinational Enterprises (MNEs). US MNEs are asked to report key operation statistics of their foreign affiliates, such as sales and exports/imports. We estimate the size of US business interests in China, using data from the US BEA survey. The total sales by US firms in China were $372 billion in 2015, including $223 billion through their subsidiaries in China and $150 billion through US exports to China. The sales earned by US subsidiaries in China included $171 billion of manufactured goods and $51 billion of services.
The same set of data from the US shows that Chinese firms sold $402 billion of goods and services to the US in 2015: $10 billion through Chinese subsidiaries in the US and $393 billion through exports. This suggests a net balance of -$30 billion from the US perspective in 2015. We define it as the "aggregate sales balance," which includes both trade balance (-$243 billion) and sales generated through subsidiaries, FDI operations in destination countries ($213 billion).
Interestingly, both the trade balance and the aggregate sales balance widened before 2009, but their trend has diverged since then. The trade balance continued to rise while the aggregate sales balance declined from -$110 billion in 2008 to -$30 billion in 2015. The surge of sales by US subsidiaries in China drove this decline: BEA data shows that China accounted for one-third of the incremental sales by US subsidiaries globally between 2010 and 2015.
The BEA survey is only available up to 2015. We used China sales data from US listed MNEs’ annual reports to update our estimates of the bilateral “aggregate sales balance” to 2017. We project that, from the US perspective, this balance has turned from a deficit of -$30 billion in 2015 to a surplus of $7 billion in 2016 and $20 billion in 2017 (Figure 2).
Figure 2: Aggregate Sales Balance, the US and China
The BEA database also allows us to look at the bilateral balance between the US and other countries. Interestingly, Mexico exhibits a similar pattern to China. Mexico ran a bilateral trade surplus against the US, but a bilateral deficit against the US once US multinationals’ sales in Mexico were taken into consideration. Canada mirrors this trend, as well. In contrast, Japan and Germany ran a surplus against the US in both trade balance and the aggregate sales balance (Figure 3). These interesting bilateral balances reflect comparative advantages: US multinationals tend to localize their production only in countries with lower costs (China, Mexico, and Canada).
Figure 3: US aggregate sales balance with major trade partners, 2015
A popular argument is that the US multinationals shifted jobs abroad. The truth may be quite the opposite. US multinationals are big domestic employers; their US parent companies employed 28 million people in 2015. This accounted for about a fifth of total US employment. Globally, US multinationals employed 45 million people in 2015, of which only 17 million worked for their foreign affiliates. More than 60% of workers were employed domestically. The share of domestic employment in MNEs has been quite stable in recent years.
Studies have shown that foreign affiliate activities tend to complement, not substitute for, parent company activities in the US (Slaughter, 2009). Many foreign subsidiaries are classified as operating in different businesses from their parent companies. Employment in foreign subsidiaries and in parent companies tends to move in the same direction (i.e., when subsidiaries increase employment, parent company employment also increases). One empirical study estimated that for each 10% increase in foreign employee compensation, domestic employee compensation increases by 3.7% (Desai and others, 2009).
This is not to say that globalization has no negative impacts on domestic employment. While the benefits of globalization are significant and widespread, foreign competition may disproportionately hurt some industries and geographic locations. Some researchers suggested that China’s unprecedented scale and rapid rise in global trade has created identifiable damage to US industries such as furniture, toys, and sporting goods (Autor and others, 2013). Labor market adjustment to this shock has been very slow in some areas, with wages depressed and unemployment elevated for a prolonged time (Autor and others, 2016).
But the negative impact is clearly not the full picture, and it seems to have phased out. The US currently has a tighter labor market than most other countries in the world. The unemployment rate is at its lowest level in decades. This suggests that the "China shock" to employment is not large and widespread. The US labor force as a whole still benefits from globalization; displacements from foreign competition are likely small and not widespread. The adjustment in the labor market may have been slow but it seems to have already completed on a macro level. Escalation of the trade war between the US and its major trading partners would be negative for US multinationals and the US labor market.
The best policy responses to help dislocated workers, as some have argued, involve providing better public services in affected regions and improving labor mobility (Senses, 2017). China’s rising demand for US products, such as food and energy, may also help some of the regions that have been negatively affected by globalization.
(Zhiwei Zhang, Deutsche Bank AG, Hong Kong; Yi Xiong, Deutsche Bank AG, Hong Kong; Xinyu Ji, Deutsche Bank AG, Hong Kong)
Autor, David, David Dorn, and Gordon H. Hansen (2013). “The China syndrome: Local labor market effects of import competition in the United States,” American Economic Review, 103(6), 2121-68.
Autor, David, David Dorn, and Gordon H. Hansen (2016). “The China Shock: Learning from labor-market adjustment to large changes in trade,” Annual Review of Economics, 8, 205-240.
Desai, Mihir. A, C. Fritz Foley, and James R. Hines Jr. (2009), “Domestic effects of the foreign activities of US multinationals,” American Economic Journal: Economic Policy, 1(1), 181-203.
Internet Society of China (2017), “China Mobile Internet Development and Security Report 2017,” http://www.isc.org.cn/zxzx/qt/listinfo-35398.html.
Kraemer, Kenneth L. , Greg Linden, and Jason Dedrick (2011), “Capturing Value in Global Networks: Apple’s iPad and iPhone,” University of California Irvine, http://pcic.merage.uci.edu/papers/2011/value_ipad_iphone.pdf.
Senses, Mine (2017), “Globalisation and US labour markets,” https://voxeu.org/article/globalisation-and-us-labour-markets, August 2017.
Slaughter, Matthew J. (2009), “How US multinational companies strengthen the US economy,” Business Roundtable, Spring, 2009.

Latest
Most Popular
- VoxChina Covid-19 Forum (Second Edition): China’s Post-Lockdown Economic Recovery VoxChina, Apr 18, 2020
- China’s Joint Venture Policy and the International Transfer of Technology Kun Jiang, Wolfgang Keller, Larry D. Qiu, William Ridley, Feb 06, 2019
- China’s Great Housing Boom Kaiji Chen, Yi Wen, Oct 11, 2017
- Wealth Redistribution in the Chinese Stock Market: the Role of Bubbles and Crashes Li An, Jiangze Bian, Dong Lou, Donghui Shi, Jul 01, 2020
- The Dark Side of the Chinese Fiscal Stimulus: Evidence from Local Government Debt Yi Huang, Marco Pagano, Ugo Panizza, Jun 28, 2017
- What Is Special about China’s Housing Boom? Edward L. Glaeser, Wei Huang, Yueran Ma, Andrei Shleifer, Jun 20, 2017
- Privatization and Productivity in China Yuyu Chen, Mitsuru Igami, Masayuki Sawada, Mo Xiao, Jan 31, 2018
- Evaluating Risk across Chinese Housing Markets Yongheng Deng, Joseph Gyourko, Jing Wu, Aug 02, 2017
- How did China Move Up the Global Value Chains? Hiau Looi Kee, Heiwai Tang, Aug 30, 2017
- China’s Shadow Banking Sector: Wealth Management Products and Issuing Banks Viral V. Acharya, Jun Qian, Zhishu Yang, Aug 09, 2017


