A Bridge on Economic Issues between China and the World


 Facebook
  Twitter
  Instagram
 WeChat
  Email
Email Forecasting China’s Economic Growth

The question of how fast the Chinese economy will grow continues to intrigue policymakers and researchers alike. In a recent paper, Harvard economist Robert J. Barro (2016) estimates that China’s economic growth per year “is likely to fall soon to a range of 3.5-4.5%,” adjusted by a 0.5% population growth rate. The Chinese media, however, has expressed a less pessimistic view, suggesting that the future (real) GDP growth path will resemble an L-shape path (i.e., stabilizing around the current level of 6.5% per year). Professor Daokui Li at Tsinghua University, a former member of the Monetary Policy Committee of the People's Bank of China, whose views are considered representative of Chinese academia , offers the even more hopeful view that the future growth path likely will take a U-shape. Somegovernment officials, including the press representative of China National Bureau of Statistics (NBS), Laiyun Sheng, have echoed this academic optimism.
In addition to these divergent views, there is widespread suspicion that the GDP growth rates published by the NBS have overstated actual growth in China, especially for the last several years. New research from Clark, Pinkovskiy, and Sala-i-Martin (2017), however, confronts this skepticism with the help of satellite-recorded data on nighttime lights, using these data “as an independent benchmark for comparing various published indicators” of the Chinese economy. These authors provide evidence that China’s GDP growth may be underestimated rather than exaggerated. The pros and cons associated with the quality of GDP statistics have been extensively discussed in, for example, Holz (2013), Fernald, Malkin, and Spiegel (2013), and Nie (2016). All of these debates imply that we should not simply abandon official GDP statistics without viable and authoritative alternatives.
The most urgent problem facing policymakers today is a lack of rigorous and systematic research in the evaluation of out-of-sample forecasts of China's macroeconomy. The dearth of this research is surprising, as China has emerged as the second largest economy in the world. For the Federal Reserve System and many other central banks, macroeconomic forecasting is an integral part of the policymaking process. In this context, timely policy projections based on Chinese macroeconomic data are badly needed.
The econometric forecasting model
In a recent paper, we develop a replicable econometric model—a Bayesian vector autoregression—to forecast China's macroeconomy, with an emphasis on GDP growth and consumer price index (CPI) inflation (i.e., the two predominant variables studied by many central banks for monetary policy analysis). Some models, such as China's Annual Macroeconomic Model, developed jointly by the Chinese Academy of Social Science and the NBS (CASS-NBS), and China's Quarterly Macroeconomic Model, developed by Xiamen University (CQMM), do not have complete information about the model structures necessary for independent evaluation. Replicable models like ours are desirable because their forecasting performance can be evaluated objectively and on a continual basis.
For two main reasons, our model outperforms a host of other popular forecasting models used in the literature, as well as the average forecasts provided by the Blue Chip Economic Indicators surveys of commercial forecasters. First, we include the key variables that influence output growth, such as M2 supply—the primary monetary policy instrument in China—and investment. If the model missed these variables, it would misrepresent reality and its forecasting performance would deteriorate. Second, we impose on the model the presumption that these macrovariables tend to move together over the long-run. Because of this comovement belief, often called “the cointegration prior,” the model’s predictability is especially strong over the forecast horizon of three to four years:
The average forecast error for predicting annual GDP growth over the four-year horizon from 2011 to 2015 is less than 0.8%, compared to the 2-4% error produced by other models.
The average forecast error for predicting annual CPI inflation over the four-year horizon from 2011 to 2015 is less than 0.4%.
For the U.S. economy, forecasting inflation from replicable models is a top priority for policymakers and academic researchers (Stock and Watson 2007). For China, however, it is the ability to predict GDP growth that is most important for policy analysis. While our model is competitive with other models in predicting CPI inflation, its superior performance in predicting GDP growth lends it credibility for policy projections and other analyses.
A major consequence of future GDP growth
Based on our model’s simulations, China’s GDP growth likely would slow to 5.5%-6% if the government were willing to reduce the growth of fixed-asset investment (FAI) from 15% to 8%. According to our estimation, a five percentage point reduction in the current FAI growth rate would lead to a one-half percentage point fall in GDP growth, but would increase the consumption-output ratio by 20% from the current level over the five-year horizon. This tradeoff between consumption and investment is difficult to quantify without an accurate forecasting model. Our simulations indicate that rapid adjustments in reducing investment growth would run the risk of significantly slowing the economy.
If such a tradeoff were to occur in the future, it would be the result of China’s imbalanced growth in the past. Figure 1 provides two striking facts about China’s economy that are seldom discussed but are essential for comprehending the country’s growth prospects. Consumption as a fraction of GDP steadily declined during the observed period of rapid GDP growth (the bottom chart of Figure 1), while investment as a fraction of GDP steadily increased during the same period (the top chart of Figure 1).

The role of monetary policy in predicting the future
Despite these recent problems, Chinese monetary policy still plays an important role in promoting economic growth through investment. Unlike interest rate-based monetary policy in many countries, Chinese policy is quantity-based. That is, the PBC has used M2 growth as its primary policy instrument, even as it now contemplates a gradual transition to using interest rates as a major tool. Indeed, in Premier Li’s speech at the 2017 National People’s Congress, monetary policy was specified at 12% M2 growth in 2017 in order to support the overarching target of 6.5% GDP growth. Notably, our simulations show that M2 growth has much stronger predictive power than interest rates for forecasting investment and GDP growth.
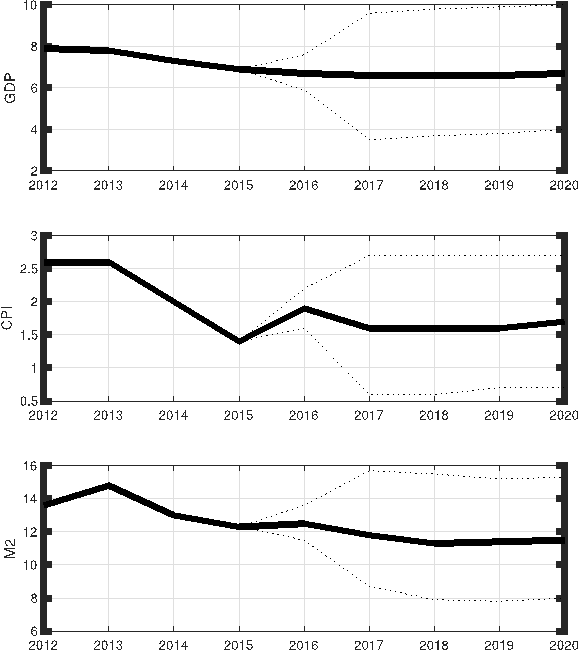
Figure 2 plots the model’s unconditional (benchmark) forecasts of GDP growth, CPI inflation, and M2 growth based on the data available through June 2016. The .68 probability bands display a degree of uncertainty about the historical forecast errors, with the lower probability band of GDP growth dipping as low as 3.5%. According to the most likely path (marked by the solid lines), however, the model supports an L-shape path of GDP growth that hovers around 6.5% over the next four years.
Figure 2: Unconditional out-of-sample forecasts made in June of 2016, expressed as annual growth rate (%). The dotted lines indicate .68 probability bands.
|
Horizon |
Unconditional |
On M2 |
On repo |
On deposit rate |
|
2016 |
6.7 |
6.7 |
6.8 |
6.9 |
|
2017 |
6.6 |
6.1 |
6.6 |
6.9 |
|
2018 |
6.6 |
5.9 |
6.6 |
6.8 |
|
2019 |
6.6 |
5.9 |
6.6 |
6.8 |
|
2020 |
6.7 |
6.0 |
6.7 |
6.9 |
We also consider a policy scenario in which M2 growth would slow from 12% in 2016 to 10% in 2017 and finally to 9% thereafter, which is (in magnitude) much less dramatic than the interest rate increases considered above. Predicted CPI inflation is slightly lower than the unconditional forecast path, but the prediction of future GDP growth is considerably lower, down from 6.6% to 5.9% (Table 1). As changes in M2 growth exert more influence on GDP growth than do similar changes in interest rates, our forecasting model serves as a practical tool for gauging the dynamic impact on the Chinese economy of the transition from M2 growth to interest rates as the primary policy instrument.
Author’s note: The views expressed herein are those of the author and do not necessarily reflect the views of the Federal Reserve Bank of Atlanta or the Federal Reserve System.
(Patrick Higgins, Federal Reserve Bank of Atlanta; Tao Zha, Federal Reserve Bank of Atlanta; Karen Zhong, Shanghai Advanced Institute of Finance, Shanghai Jiao Tong University.)
References
Brunnermeier, M. K., M. Sockin, and W. Xiong (2017), “China’s Gradualistic Economic Approach: Does It Work for Financial Development?” American Economic Review Papers & Proceedings, May, 1-6.
Chen, K., J. Ren, and T. Zha (2017), “The Nexus of Monetary Policy and Shadow Banking in China,” NBER Working Paper 23377, May.
Clark, H., M. Pinkovskiy, and X. Sala-i-Martin (2017), “China's GDP Growth May be Understated,” NBER Working Paper 23323, April.
Fernald, J., I. Malkin, and M. Spiegel (2013), “On the Reliability of Chinese Output Figures,” FRBSF Economic Letter 2013-08, Federal Reserve Bank of San Francisco. http://www.frbsf.org/economic-research/ les/el2013-08.pdf.
Holz, C. (2013), “The Quality of China’s GDP Statistics,” Working Paper 487, Stanford Center for International Development.
Higgins, P., T. Zha, and W. Zhong (2016), “Forecasting China’s Economic Growth and Inflation,” China Economic Review, 41, 46-61.
Stock, J. H. and M. W. Watson (2007), “Why Has U.S. Inflation Become Harder to Forecast?” Journal of Money, Credit and Banking, 39 (Supplement s1), 3–33.
Nie,J.(2016), “Gauging the Strength of Chinese GDP Growth,” The Macro Bulletin, pp. 1–3, http://macrobulletin.kcfed.org.

Latest
Most Popular
- VoxChina Covid-19 Forum (Second Edition): China’s Post-Lockdown Economic Recovery VoxChina, Apr 18, 2020
- China’s Great Housing Boom Kaiji Chen, Yi Wen, Oct 11, 2017
- China’s Joint Venture Policy and the International Transfer of Technology Kun Jiang, Wolfgang Keller, Larry D. Qiu, William Ridley, Feb 06, 2019
- The Dark Side of the Chinese Fiscal Stimulus: Evidence from Local Government Debt Yi Huang, Marco Pagano, Ugo Panizza, Jun 28, 2017
- Wealth Redistribution in the Chinese Stock Market: the Role of Bubbles and Crashes Li An, Jiangze Bian, Dong Lou, Donghui Shi, Jul 01, 2020
- What Is Special about China’s Housing Boom? Edward L. Glaeser, Wei Huang, Yueran Ma, Andrei Shleifer, Jun 20, 2017
- Evaluating Risk across Chinese Housing Markets Yongheng Deng, Joseph Gyourko, Jing Wu, Aug 02, 2017
- Privatization and Productivity in China Yuyu Chen, Mitsuru Igami, Masayuki Sawada, Mo Xiao, Jan 31, 2018
- How did China Move Up the Global Value Chains? Hiau Looi Kee, Heiwai Tang, Aug 30, 2017
- China’s Shadow Banking Sector: Wealth Management Products and Issuing Banks Viral V. Acharya, Jun Qian, Zhishu Yang, Aug 09, 2017


