A Bridge on Economic Issues between China and the World


 Facebook
  Twitter
  Instagram
 WeChat
  Email
Email An Empirical Overview of Chinese Capital Market
We provide an empirical review of the Chinese capital market, focusing on the basic return and risk characteristics of its major asset classes, as well as a comparison to the US market. All major asset classes in China have significant higher volatilities than their counterparts in the US market, but they do not always yield larger returns. Small-company stocks, short-, medium-, and long-term treasury bonds outperform their US counterparts, while large stocks underperform and long-term enterprise bonds yield similar returns.
Accompanying with China’s phenomenal economic growth, its capital market has experienced rapid growth in the past three decades. Several recent reviews have provided useful background and context for understanding these developments, including Allen, Qian, and Gu (2017), Carpenter and Whitelaw (2017), Allen, Qian, and Qian (2019), Amstad, Sun, and Xiong (2020), Hu, Pan, and Wang (2021), and Hu and Wang (2022). In this article, we discuss the key empirical features of the major asset classes in China’s capital market, focusing on their risk and return characteristics and comparison to the US market.
Risk and Return Characteristics
We focus on seven major financial asset classes in China: large company stocks, small company stocks, long-term treasury bonds, medium-term treasury bonds, short-term treasury bonds, long-term enterprise bonds, and a hypothetical asset returning the inflation rate. We construct an annual return series for each asset class. Interested readers can refer to Hu, Pan, and Wang (2021) for details on the construction of this return series. Due to data availability, the actual time span for each asset class is different. The set of data for large and small stocks as well as inflation spans 26 years, from 1993 to 2018; data on treasury bonds have a time span of 22 years, from 1997 to 2018; and data on enterprise bonds spans 19 years, from 2000 to 2018. The statistics reported in Table 1 are based on the available data.
In terms of the average annual returns (arithmetic mean), small stocks rank at the top among all asset classes, at 30.44% in nominal terms and 26.06% in real terms. These are followed by large stocks, which have an arithmetic mean return of 16.80% in nominal terms and 12.94% in real terms. Long- and medium-term treasury bonds show modest average annual nominal returns of 6.23% and 5.61% and average annual real returns of 4.27% and 3.66%, respectively. Long-term enterprise bonds and short-term treasury bonds have the lowest average returns.
The ranking of the arithmetic mean returns is in line with the volatility of asset returns. For nominal annual returns, the volatility of the small stock index is 66.34%, while the volatility of the large stock index is 57.22%. Long-term treasury and enterprise bonds also have high volatility, 9.66% and 8.59%, respectively, but are less volatile than stocks. Medium- and short-term treasury bonds have the lowest volatility, 6.11% and 2.01%, respectively. The pattern of volatilities based on the inflation-adjusted returns is similar.
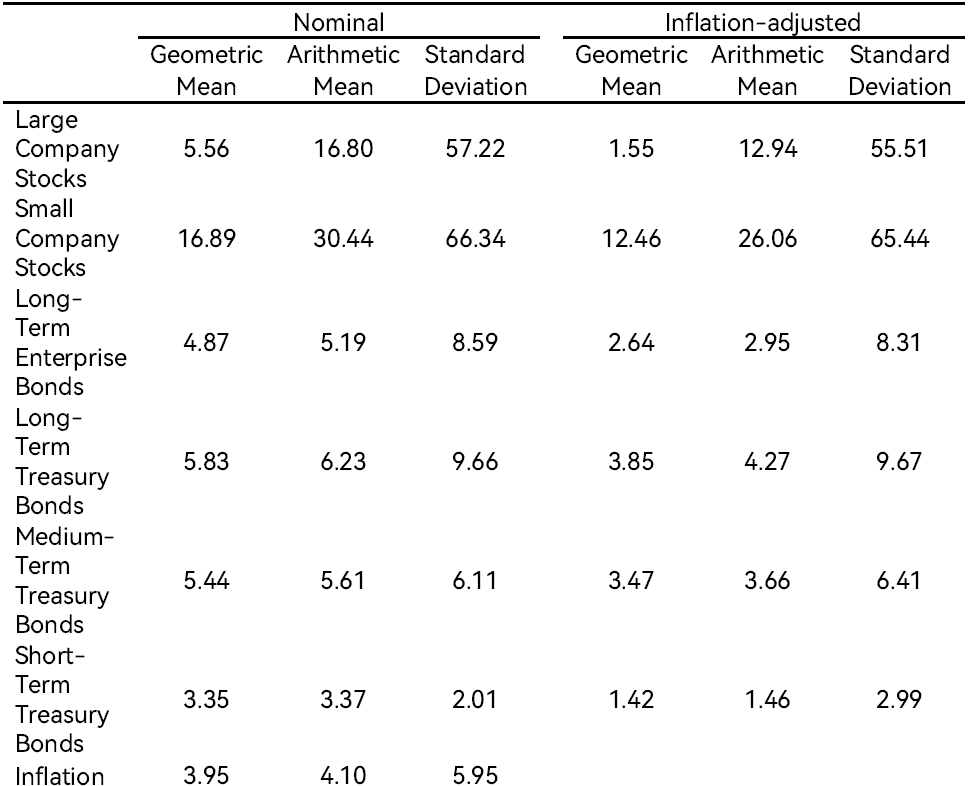
Table 1: Summary statistics of annual nominal and inflation-adjusted returns (%)
In terms of the long-run performance, small company stocks did the best, yielding an average inflation-adjusted return of 12.46% per year (the geometric mean return) from 1993 to 2018. It’s worth noting that large company stocks yielded an average inflation-adjusted return of only 1.55% per year, lower than medium- and long-term treasury bonds and only marginally better than short-term treasury bonds. Long-term enterprise bonds yielded an average inflation-adjusted return of only 2.64% per year, from 2000 to 2018.
The performance of these asset classes can also be seen in Figure 1, where we plot the wealth indexes (top panel) and inflation-adjusted wealth indexes (bottom panel), i.e., the growth of 1 RMB invested from the beginning of 1993, 1997, and 2000 to the end of 2018. Three graphs are displayed in each panel because the starting point of data is different across the asset classes.
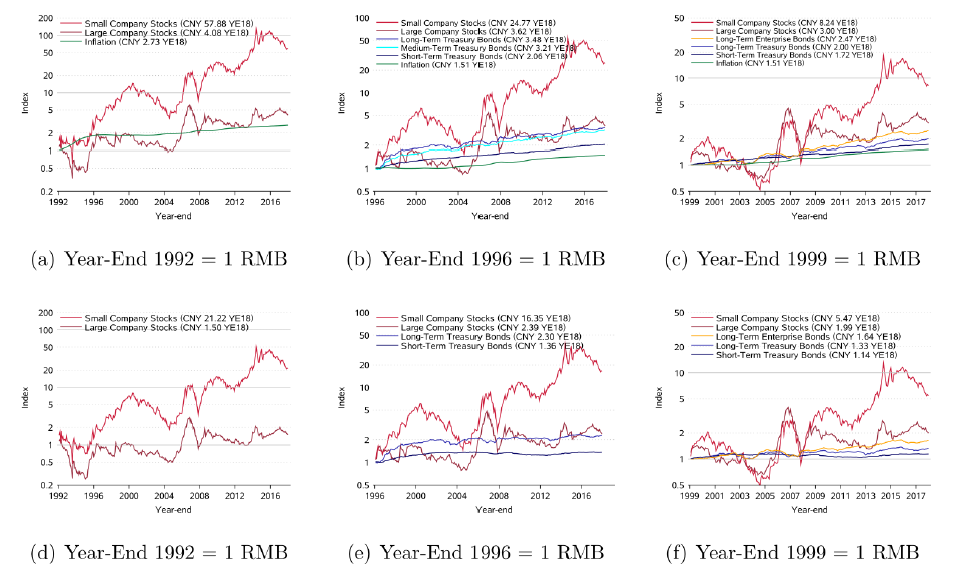
Figure 1: Nominal (a)-(c) and inflation-adjusted (d)-(e) wealth indexes of investments in the Chinese capital market (year-end 1992, 1996, 1999 =1 RMB)
Comparison with the US market
To compare the return and risk characteristics of major asset classes in the Chinese capital market with those in the US market, we convert local currency returns on major Chinese asset classes into US dollar returns using the official exchange rates of renminbi. Even though these returns are only theoretical for US investors and difficult to achieve in practice due to China’s strict capital controls, the comparison can offer some useful insights on the uniqueness of the Chinese capital market.
The return volatilities in the Chinese capital market are substantially higher than their counterparts in the US market, as shown in Table 2. The standard deviations of the annual returns on large and small company stocks in China are above 60%, two to three times larger than in the US market. For all Chinese bond indexes as well as inflation, their annual return volatilities are also higher than their counterparts in the US market.
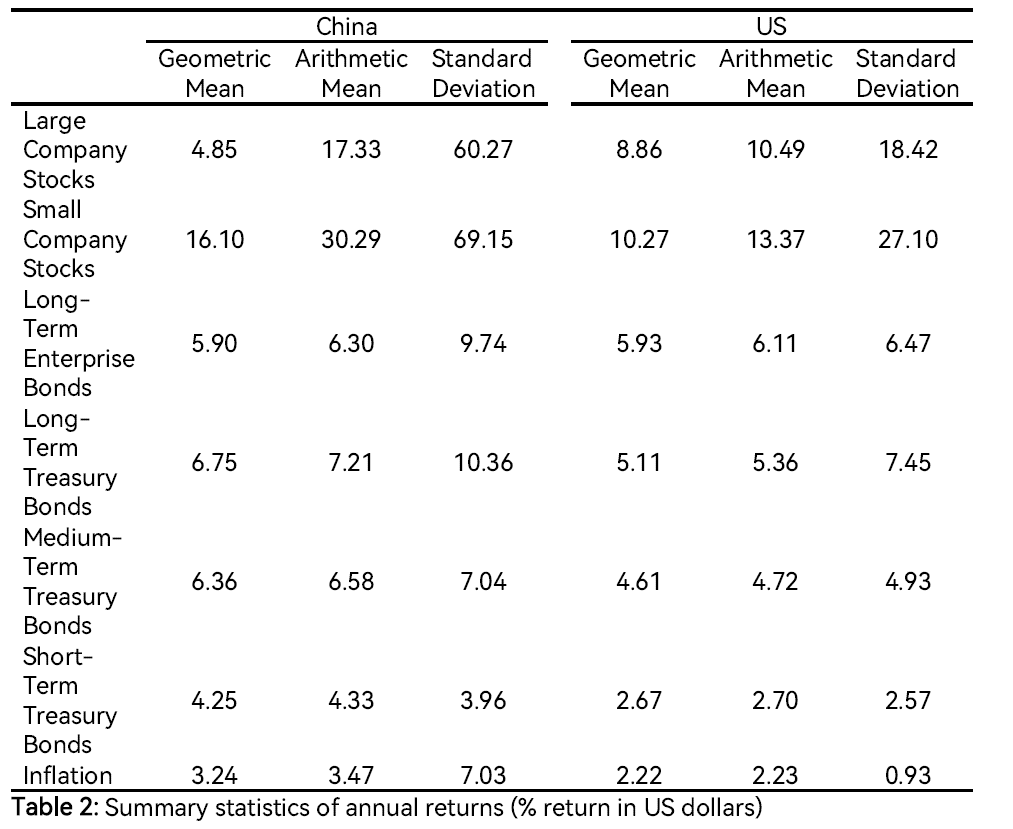
Despite their substantially higher volatility, assets in China do not always offer higher returns than their US counterparts. The geometric mean of annual returns on large firm stocks in China, for example, is 4.85%, around four percentage points lower than the US market’s 8.86%. Long-term corporate bonds yield an average return of 5.90% per year (geometric mean) in China, very close to their counterparts in the US market. On the other hand, for small company stocks, long-term treasury bonds, medium-term treasury bonds, short-term treasury bonds, and inflation in the Chinese market, the geometric mean returns are 16.10%, 6.75%, 6.36%, 4.25%, and 3.24%, respectively, higher than their counterparts in the US market.
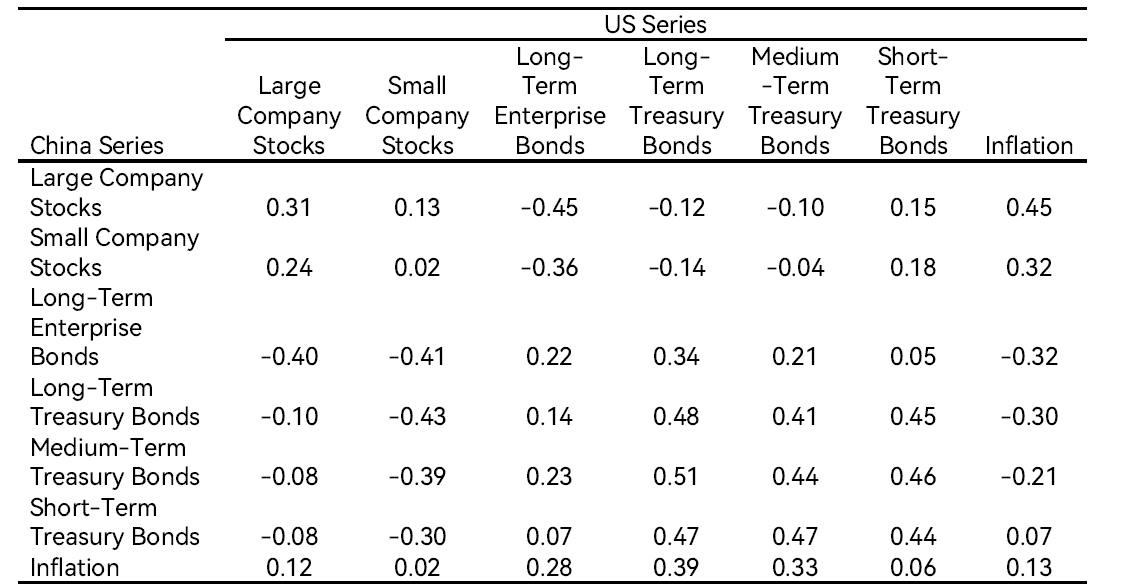
The correlations between the returns of major assets in China and those in the US are reported in Table 3. Large company stocks in China are positively correlated with large company stocks (0.31), negatively correlated with long-term corporate bonds (-0.45), and positively correlated with inflation (0.45) in the US market. Compared with large company stocks in China, small company stocks in China are less correlated with assets in the US market. The returns on Chinese long-term enterprise bonds are negatively correlated with US stock returns and are positively correlated with US corporate and treasury bond returns. The returns on Chinese treasury bonds are all positively correlated with those in the US, with correlations ranging between 0.41 and 0.51 depending on maturity. Inflation in China is positively correlated with all assets in the US market.
Conclusion
China’s capital market has experienced phenomenal growth since its revival in the early 1990s. We aim to provide the basic relationship between risk and return of the different asset classes in the market. As China becomes more integrated into the global financial system, access to the Chinese capital market could help improve global diversification and support broader financial stability for global investors. On the other hand, the increasing presence of foreign investors may have meaningful impact on capital allocation efficiency, information disclosure practices, asset price informativeness, and corporate governance standards in China.
References
Allen, Franklin, Jun Qian, and Xian Gu. 2017. “An Overview of China’s Financial System.” Annual Review of Financial Economics 9: 191–231. https://doi.org/10.1146/annurev-financial-112116-025652.
Allen, Franklin, Jun Qian, and Meijun Qian. 2019. “A Review of China’s Institutions.” Annual Review of Financial Economics 11: 39–64. https://doi.org/10.1146/annurev-financial-110118-123027.
Amstad, Marlene, Guofeng Sun, and Wei Xiong. 2020. The Handbook of China’s Financial System. Princeton, NJ: Princeton University Press.
Carpenter, Jennifer N., and Robert F. Whitelaw. 2017. “The Development of China’s Stock Market and Stakes for the Global Economy.” Annual Review of Financial Economics 9, 233–57. https://doi.org/10.1146/annurev-financial-110716-032333.
Hu, Grace Xing, Jun Pan, and Jiang Wang. 2021. “Chinese Capital Market: An Empirical Overview.” Critical Finance Review 10 (2): 125–206. http://dx.doi.org/10.1561/104.00000097.
Hu, Grace Xing, and Jiang Wang. 2022. “A Review of China’s Financial Markets.” Annual Review of Financial Economics. Forthcoming.

Latest
Most Popular
- VoxChina Covid-19 Forum (Second Edition): China’s Post-Lockdown Economic Recovery VoxChina, Apr 18, 2020
- China’s Great Housing Boom Kaiji Chen, Yi Wen, Oct 11, 2017
- China’s Joint Venture Policy and the International Transfer of Technology Kun Jiang, Wolfgang Keller, Larry D. Qiu, William Ridley, Feb 06, 2019
- The Dark Side of the Chinese Fiscal Stimulus: Evidence from Local Government Debt Yi Huang, Marco Pagano, Ugo Panizza, Jun 28, 2017
- Wealth Redistribution in the Chinese Stock Market: the Role of Bubbles and Crashes Li An, Jiangze Bian, Dong Lou, Donghui Shi, Jul 01, 2020
- Evaluating Risk across Chinese Housing Markets Yongheng Deng, Joseph Gyourko, Jing Wu, Aug 02, 2017
- What Is Special about China’s Housing Boom? Edward L. Glaeser, Wei Huang, Yueran Ma, Andrei Shleifer, Jun 20, 2017
- Privatization and Productivity in China Yuyu Chen, Mitsuru Igami, Masayuki Sawada, Mo Xiao, Jan 31, 2018
- Daily Price Limits and the Magnet Effect Ting Chen, Zhenyu Gao, Jibao He, Wenxi Jiang, Wei Xiong, Oct 25, 2017
- How did China Move Up the Global Value Chains? Hiau Looi Kee, Heiwai Tang, Aug 30, 2017


