A Bridge on Economic Issues between China and the World


 Facebook
  Twitter
  Instagram
 WeChat
  Email
Email The Great Chinese Inequality Turnaround

Since the reform era began in 1978, analysts and policymakers have taken an intense interest in Chinese income inequality, just as they have with the country’s spectacular economic growth and its extraordinary poverty reduction efforts—perhaps the most dramatic in human history. Sharply increasing inequality became an integral part of the Chinese development narrative, with some commentators arguing that this was the inevitable cost of high growth rates, while others warned of the social consequences of the widening gaps.
Our recent research attempts to provide a comprehensive assessment of what the data show, a deeper look into the patterns of inequality change, and preliminary explanations for the observed trends. Our basic conclusion is that there does indeed appear to be a turnaround occurring in Chinese inequality from the latter part of the first decade of the 2000s, and that the explanations lie both in policy changes and in the nature of structural transformation in China (Kanbur, Wang, and Zhang 2017).
Our assessment uses household level data from the China Academy of Social Sciences and Beijing Normal University’s Chinese Household Income Project (CHIP) for 1995, 2002, and 2007 and from Peking University’s China Family Panel Studies (CFPS) for 2010, 2012, and 2014. A number of issues regarding completeness and comparability have to be addressed in order to use these data, but between them they provide a twenty-year perspective on income distribution in China, from 1995 to 2014. Analysis of regional inequality using the provincial level income and population data from the National Bureau of Statistics (NBS) and Provincial Yearbooks complements this analysis of household level data.
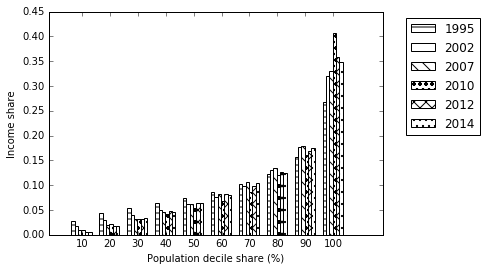
Table 1 presents the Gini coefficient for six years covering 1995 through 2014. We see that the Gini coefficient has an inverted U shape pattern, with the turning point at 0.533 in 2010, and we find similar trends in other inequality measures. Figure 1 shows that the income share of the top 10% reached its highest point in 2010, at around 0.4, and then declined. Other economists have also demonstrated a recent decline in the share of the top of the distribution (Alvaredo et al. 2017; Piketty et al. 2017). The top-bottom decile income ratio went up from 1995 to 2012 and declined slightly afterwards. The level of inequality is rather high compared with that of many Organization for Economic Co-operation and Development (OECD) countries—and even higher compared with Scandinavian countries—but it is comparable to the other BRICS (Brazil, Russia, India, China, and South Africa) economies (see Note 1).
Table 1: Inequality Measures from Household Survey Data
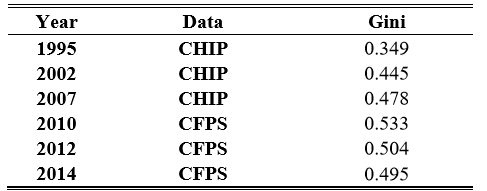
Note: We adjusted CHIP income by excluding the components that are not in CFPS. CHIP 2007 uses the NBS survey data. Full details in Kanbur, Wang, and Zhang (2017)
Figure 1: Decile Income Share (Adjusted Income)
The combination of CHIP and CFPS data give us six observations spanning 1995 to 2014, based on household surveys. An alternative data perspective, useful for capturing long-term annual trends, was introduced in Kanbur and Zhang (1999, 2005). This method uses NBS data on provincial consumption per capita, broken down by rural and urban for each province. Combining this with rural-urban population data for each province, we can construct a synthetic national consumption distribution that assumes equality within rural areas and within urban areas of each province. This will lead to an understatement of the level of inequality, but the trend over time may nevertheless convey information about the evolution of inequality.
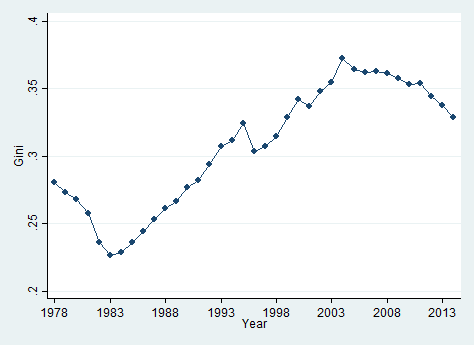
Figure 2 presents the Gini coefficient over time for the synthetic distribution, which focuses on regional inequality in China. Inequality went down a little after 1978 and began to rise after 1985. The Figure shows a peak in the mid-2000s, with a decline thereafter. The Gini values in Figure 1 and Table 1 are not comparable since they come from different data sources and use different methods. However, the broad trends after the mid-1990s, reflected by these two very different perspectives, are similar.
Figure 2: Regional Inequality in Consumption Per Capita
Overall, a careful assessment of the best data sources seems to suggest a plateauing of inequality, with a possible turning point around the first decade of the 2000s. What explains this turnaround? While a full explanation must await further detailed research, we can propose a number of hypotheses based on the transformation of China from a rural/agrarian society to an urban/industrial economy. In this framework, the national income distribution can be thought of as a weighted sum of the rural and the urban income distributions. The national inequality trend thus depends on three factors, namely (i) the gap in average income between rural and urban sectors, (ii) inequality within the rural and urban sectors, and (iii) the rate of urbanization.
Zhang, Yang, and Wang (2011) argue that China has now reached the “Lewis turning point,” where rural-to-urban migration begins to tighten rural labor markets, thereby mitigating the rural-urban wage differential. In addition, substantial government investment in infrastructure in the rural sector and in lagging regions—a feature of Chinese policy from the 2000s onwards (Fan, Kanbur, and Zhang 2011)—has increased economic activity and incomes in these areas.
Arguably, a number of specific policy measures have further mitigated inequality by narrowing the spread within rural and urban areas. For example, the Ministry of Labor and Social Security issued a “Minimum Wage Regulations” law in 2004 and the next decade saw rising minimum wage standards coupled with significant improvements in compliance (Kanbur, Li, and Lin 2016). A number of other social programs were introduced and strengthened in the early 2000s. In 2004, China instituted rural cooperative medical insurance, which currently covers more than 95% of the country’s rural population. The government then rolled out rural social security in 2009. Although the premiums (and therefore benefits) of the rural medical insurance and social security programs are still much lower than their urban counterparts, these programs have provided a cushion to rural residents against the costs of health care and elder care.
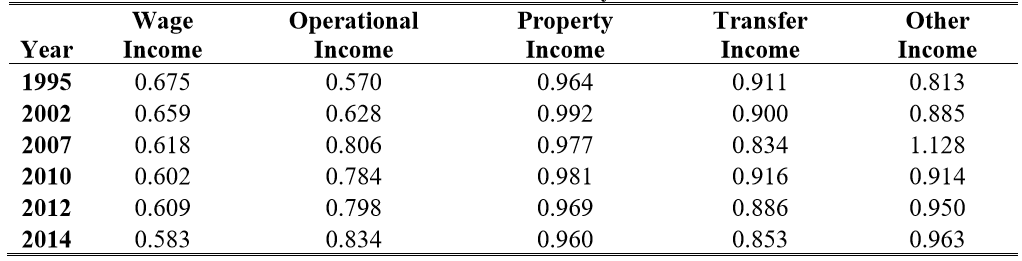
In general, tightening labor markets in rural areas, in conjunction with transfer and regulation regimes in urban and rural areas, have acted to mitigate inequality. Some evidence of this is found in Tables 2 and 3, which show the income share of five broad income sources and the Gini coefficients of income from each source. Inequality of wage income has fallen sharply, as has inequality of transfers. These are the dominant factors in total income, and so their collective declining inequality has driven the overall fall in inequality. But there is a final consideration. Holding other factors constant, the rising share of urban population income can, beyond a certain point, begin to contribute to inequality reduction. Kanbur and Zhuang (2013) argue that while countries like India have not yet reached this turning point, China—in light of its current urbanization rate—has crossed it.
Table 2: Share of income by source
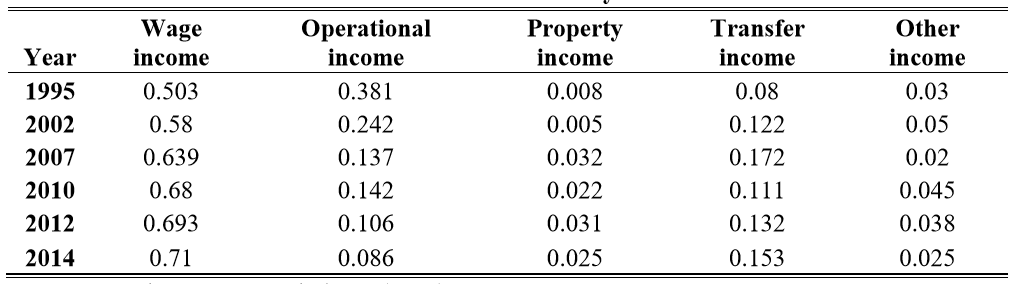
Source: Kanbur, Wang, and Zhang (2017)
Table 3: Gini of Income by Source
Our argument, in the end, suggests that a number of forces have come together recently to mitigate the sharp rise in Chinese inequality, which expanded greatly in the first quarter century of the reform era. Inequality in China remains high, with a Gini of around 0.5, but the upward trend has plateaued and has even turned downward. There has been a great turnaround in Chinese inequality, and we need to better understand the reasons for it, as well as the lessons that we can learn from it.
Note 1: A few examples of Gini coefficients for OECD countries, according to the World Bank, are United States, 41.06 (2013); France 33.1 (2012); Germany 30.13 (2011); and UK, 32.57 (2012). The Gini coefficients for Scandinavian countries are Sweden 27.4 (2012), Norway 25.9 (2012), and Denmark 29.1 (2012). The Gini coefficients for the other BRICS countries are Brazil, 52.67 (2012); Russia, 41.59 (2012); India, 35.15 (2011); and South Africa, 63.38 (2011).
(Ravi Kanbur, Cornell University; Yue Wang, Cornell University; Xiaobo Zhang, Peking University and International Food Policy Research Institute.)
Alvaredo, F., L. Chancel, T. Piketty, E. Saez, and G. Zucman (2017), “Global Inequality Dynamics: New Findings from WID.world,” NBER Working Paper 23119.
Dautovic, E., H. Hau, and Y. Huang (2017), “The Consumption Response to Minimum Wages: Evidence from Chinese Households,” Swiss Finance Institute, Research Paper No. 17-01.
Fan, S., R. Kanbur, and X. Zhang (2011), “China’s Regional Disparities: Experience and Policy,” Review of Development Finance, 2011 (1): 47–56.
Kanbur, R., C. Lin and Y. Li (2017), “Minimum Wage Competition between Local Governments in China,” Cornell University, Working Paper.
Kanbur, R., L. Wang, and X. Zhang (2017), "The Great Chinese Inequality Turnaround," IFPRI Discussion Paper 1637.
Kanbur, R., and X. Zhang (1999), "Which Regional Inequality? The Evolution of Rural-Urban and Inland-Coastal Inequality in China, 1983-1995," Journal of Comparative Economics, Vol. 27: 686-701.
Kanbur, R., and X. Zhang (2005), “Fifty Years of Regional Inequality in China: A Journey Through Central Planning, Reform, and Openness," Review of Development Economics, 9 (1): 87–106.
Kanbur, R., and J. Zhuang (2013), “Urbanization and Inequality in Asia,” Asian Development Review, 30 (1): 131–147.
Khan, A. R., and C. Riskin (2005), “China’s Household Income and Its Distribution, 1995 and 2002,” China Quarterly, 182 (June).
Piketty,T., Y. Li, and Z. Gabriel (2017), "Capital Accumulation, Private Property and Rising Inequality in China, 1978-2015," NBER Working Paper No. 23368.
Xie, Y., X. Zhang, Q. Xu, and C. Zhang (2015), "Short-term trends in China’s income inequality and poverty: evidence from a longitudinal household survey," China Economic Journal 8 (3): 1-17.
Xie, Y., and X. Zhou (2014), “Income inequality in today’s China,” Proceedings of the National Academy of Sciences of the United States of America, 111.19 (2014): 6928-2933.
Xie, Y., X. Zhang, J. Li, and Q. Ren (2014), China Livehood Report 2014, Beijing: Peking University Press [in Chinese].
Zhang, X., J. Yang, and S. Wang (2011), "China has reached the Lewis turning point," China Economic Review, 22(4): 542-554.
Zhang, W. (2012), " The Evolution of China’s Pay Inequality from 1987 to 2012," Journal of Current Chinese Affairs, 45 (2): 183–217.

Latest
Most Popular
- VoxChina Covid-19 Forum (Second Edition): China’s Post-Lockdown Economic Recovery VoxChina, Apr 18, 2020
- China’s Great Housing Boom Kaiji Chen, Yi Wen, Oct 11, 2017
- China’s Joint Venture Policy and the International Transfer of Technology Kun Jiang, Wolfgang Keller, Larry D. Qiu, William Ridley, Feb 06, 2019
- The Dark Side of the Chinese Fiscal Stimulus: Evidence from Local Government Debt Yi Huang, Marco Pagano, Ugo Panizza, Jun 28, 2017
- Wealth Redistribution in the Chinese Stock Market: the Role of Bubbles and Crashes Li An, Jiangze Bian, Dong Lou, Donghui Shi, Jul 01, 2020
- Evaluating Risk across Chinese Housing Markets Yongheng Deng, Joseph Gyourko, Jing Wu, Aug 02, 2017
- What Is Special about China’s Housing Boom? Edward L. Glaeser, Wei Huang, Yueran Ma, Andrei Shleifer, Jun 20, 2017
- Privatization and Productivity in China Yuyu Chen, Mitsuru Igami, Masayuki Sawada, Mo Xiao, Jan 31, 2018
- How did China Move Up the Global Value Chains? Hiau Looi Kee, Heiwai Tang, Aug 30, 2017
- China’s Shadow Banking Sector: Wealth Management Products and Issuing Banks Viral V. Acharya, Jun Qian, Zhishu Yang, Aug 09, 2017


