A Bridge on Economic Issues between China and the World


 Facebook
  Twitter
  Instagram
 WeChat
  Email
Email Growing like China: Firm Performance and GVC Position

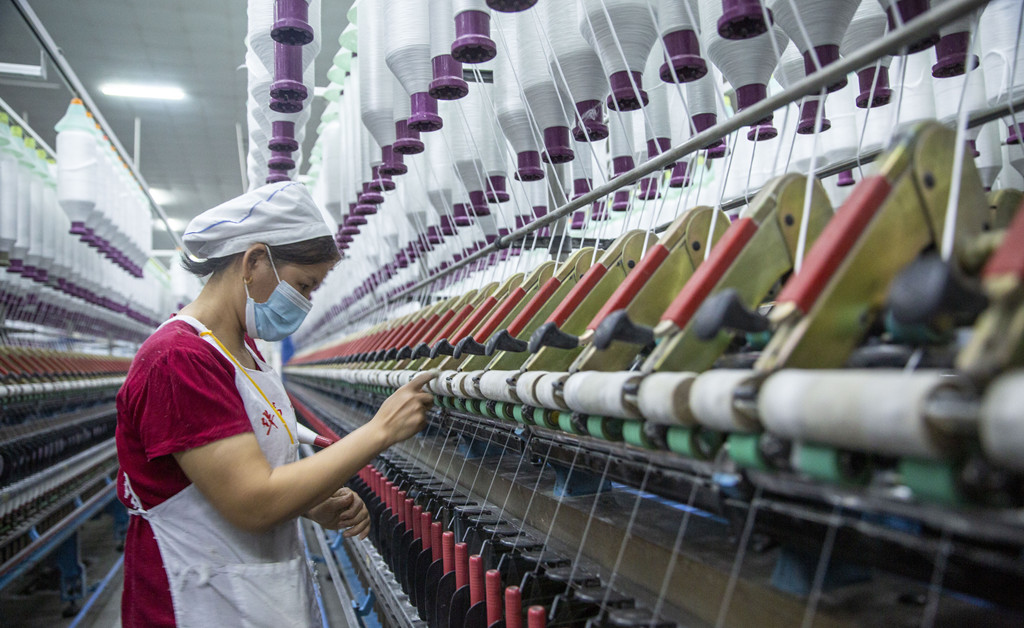
We use firm-level customs and manufacturing survey data, together with Input-Output tables for China, to examine how Chinese firms position themselves in global production lines. We document a sharp rise in the upstreamness of China’s imports, while the positioning of its exports has remained relatively stable, over the 1992-2014 period. Participation in global value chains thus appears to have facilitated an expansion in the scope of production stages undertaken within China. We observe these patterns both in the aggregate and within firms over time. Firms span more stages as they grow more productive, bigger and more experienced; at the same time, this is accompanied by a rise in input purchases, value added in production, fixed costs incurred, and profits.
Global value chains (GVCs) have been an integral feature of international trade and production in recent decades (Baldwin 2016, World Development Report 2020). For individual firms, this has presented new opportunities – as well as challenges – as production has become more fragmented across country borders. For aggregate economies, new policy questions have been raised: How do GVCs affect firm performance in the short run and country growth prospects in the long term? Do GVCs engender cross-border technology transfer and structural transformation in less developed countries, or do they instead lock such countries into low-profitability, low-growth production activities? Despite the clear policy interest, only recently has academic research begun to overcome data and conceptual difficulties to provide more systematic insights on these issues.
In recent work, we examine how Chinese firms position themselves in GVCs, as well as how this positioning evolves with productivity and performance over the firm lifecycle (Chor, Manova and Yu, Journal of International Economics 2021). China provides a fascinating context in which to study these questions. As one of the fastest growing countries over the last 30 years, China has recently expanded to become the second largest economy and the biggest exporter in the world. This economic transformation has been made possible by its dramatic globalization, marked by China’s entry into the WTO in 2001 and by various trade and industrial policies that encourage firms’ participation in GVCs (Feenstra and Wei 2010, Manova and Yu 2016).
We use firm-level customs and manufacturing survey data to characterize Chinese firms’ GVC position. We document a sharp rise in the upstreamness of China’s imports, stable positioning in its exports, and thus a rapid expansion in production stages conducted in China over the 1992-2014 period, both in the aggregate and within firms over time. Chinese firms spanned more stages as they grew more productive, bigger and more experienced. This was accompanied by a rise in input purchases, fixed costs and value added in production, as well as by higher profits (though not by higher profit margins).
Measuring GVC Position
We first exploit the 2007 China Input-Output Tables to build an industry-level measure of upstreamness for 135 industries following Antràs et al. (2012). This measure captures an industry’s stage distance to final demand. Intuitively, this is computed as the weighted-average number of stages at which the industry is used as an input before it reaches final use (i.e., is absorbed in consumption or investment). The measure ranges from 1 to 5.86, with a mean of 3.16 and a standard deviation of 1.12. Higher values are associated with more upstream sectors (e.g., rubber), and lower values indicate sectors that are more proximate to final demand (e.g., cars). Table 1 lists the 10 most upstream and 10 most downstream industries.
Table 1: Ten most and least upstream industries
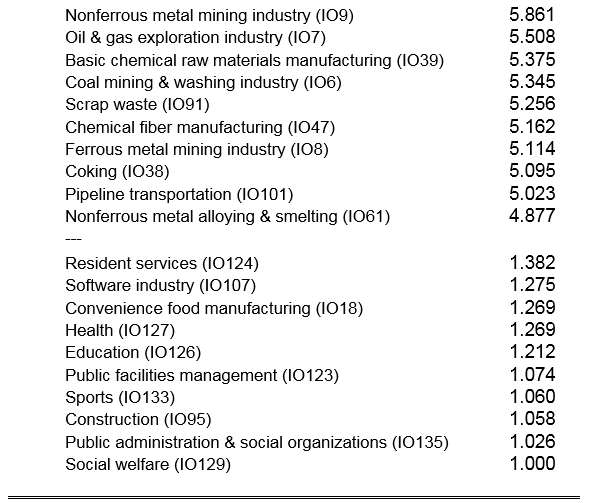
Notes: Computed from Chinese Input-Output Tables for 2007.
We capture Chinese firms’ global production line position by combining the industry measure of upstreamness with information on the composition of each firm’s trade flows. We construct the weighted-average upstreamness of a firm’s imports and exports, UM and UX, using respectively each industry’s share in the total imports and the total exports of the firm as weights. The difference between the two, UM-UX, thus reflects the span of production stages that the firm undertakes within China, either by directly performing these or by outsourcing to other suppliers in China.
Macro Trends 1992-2014
We identify three Macro Trends in China’s GVC participation. First, over 1992-2014, China’s imports became significantly more upstream, while China’s exports became slightly more proximate to final demand. Figure 1 illustrates this first-order feature of China’s aggregate trade flows. Note in particular that the rise in import upstreamness tapered off around 2008, coinciding with when China’s trade-to-GDP ratio reached its peak (IMF 2016, Frankel 2016). These aggregate trends were mainly driven by ordinary trade, rather than by processing or other trade regimes.
Figure 1: China’s aggregate global production line position
A: Import and Export Upstreamness B: Merchandize Trade to GDP (%)
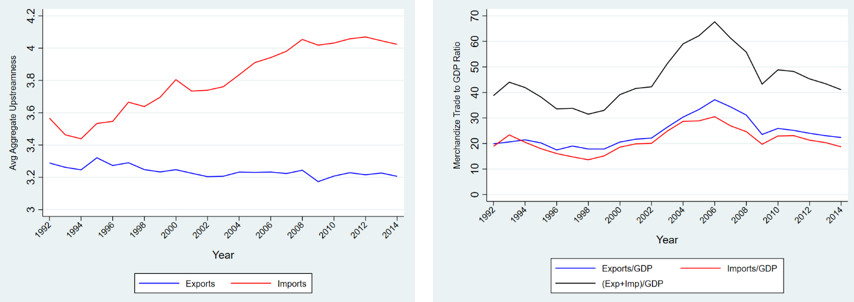
Notes: Authors’ own calculations based on Chinese Customs Trade Statistics; aggregates are based on data at the province or city level for 1992-1999 and data at the firm level for 2000-2014. Information on China’s GDP used in Panel B is from the World Development Indicators.
Second, the rise in aggregate import upstreamness is explained both by the net entry of firms that tend to import further upstream (the extensive margin) and by within-firm increases in import upstreamness (the intensive margin).
Third, these patterns in aggregate upstreamness are also present in the within-firm trajectory over time. Through a series of regressions with firm fixed effects, we show that imports became significantly more upstream, exports became moderately more proximate to final demand, and the implied span of production stages performed in China by the typical firm increased quickly during 2000-2014.
Firm Lifecyle Facts
Building on the above, we establish three Firm Facts that document the evolution of Chinese firms’ attributes, production line position, operations, and performance over the firm lifecycle.
First, when firms become more productive, bigger or more experienced, they import significantly more upstream, export moderately closer to final demand, and span more production stages in China. Table 2 reports selected regression results that substantiate these facts, for particular measures of firm productivity (real value added per worker), firm size (sales), and firm experience (age). The results hold too when using alternative measures, such as revenue based TFP computed à la Olley-Pakes, Levinsohn-Petrin, or Ackerberg-Caves-Frazer. These findings are further robust to an extensive set of specification checks, including the use of demand or supply shock measures to identify causal effects of firm productivity.
Table 2: Global production line position over the firm lifecycle
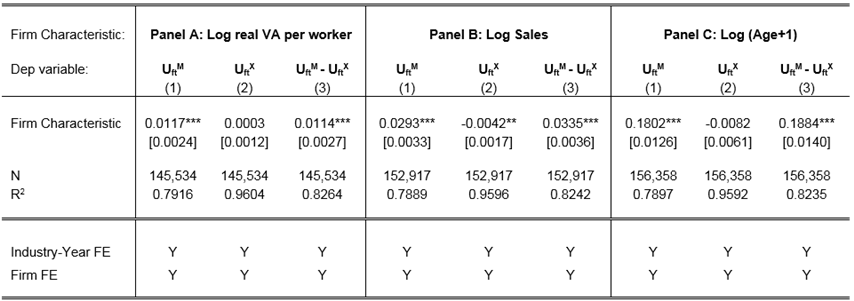
Notes: The sample comprises the matched CCTS-ASIF 2000-2006 panel of non-intermediary firms, in all years in which the firm both imports and exports. Each panel reports a separate set of regressions using the firm productivity, size or experience measure indicated in the panel heading; for each productivity, size or experience measure, observations smaller than the 1st percentile or larger than the 99th percentile are dropped. Standard errors are clustered by firm; ***, **, and * denote significance at the 1%, 5%, and 10% levels respectively. All columns include firm and industry-by-year fixed effects, as well as firm-level measures of capital and skill intensity.
Second, when firms span more production stages in China, they increase their total input purchases, labor usage (wagebill), and value added in production, all proportionately with sales.
Third, when firms undertake more production stages in China, they raise their fixed costs and assets, proxied respectively by inventory holdings and by net plant, property and equipment. They moreover earn higher profits, although their profit margins (e.g., profit-to-sales ratio) remain largely unchanged.
Of note, these three facts pertaining to firms’ span of production stages, UM-UX, hold when we control for the upstreamness of the firm’s exports, UX , to capture where along global production chains the firm is positioned relative to final demand.
Trade-offs in Firms’ GVC Position
How do firms decide where to operate along GVCs and which production stages to perform in order to maximize profits? Motivated by the Firm Facts above, we develop a model in which firms decide: (i) how much and how upstream an intermediate input to purchase from upstream suppliers; (ii) how much value to add in processing these inputs into more complete products; and (iii) how much and how proximate to final demand an output to produce. The decisions made over (i) and (iii) in turn determine the firm’s span of production stages.
Looking upstream, firms face a trade-off between sourcing a more fully processed but more expensive input and incurring instead the fixed and variables costs of performing the inframarginal production steps. Looking downstream, firms likewise weigh the benefit of selling a more finished output at a higher market price against the fixed and variable costs of undertaking more production stages. Suppose that these inframarginal fixed and variable costs are relatively small and that the production function features complementarity between the scale of production and the span of stages performed. An exogenous positive shock to productivity or demand would then induce a firm to both span more production stages and operate on a bigger scale, specifically by scaling up its operations in proportion to total sales. These implications allow us to rationalize the Macro Trends and Firm Facts that we have established on the evolution of the global production line position of Chinese firms.
Policy Implications
Our analysis informs how China’s participation in global value chains has helped shape the structure of trade flows at the aggregate level through its impact on firm-level decisions over production stages to undertake. Our novel findings thus shed light on policy questions about the implications of GVCs for firm and aggregate growth, and challenge concerns about GVC-induced stagnation traps.
The new evidence we uncover suggests that the fragmentation of production across countries can enable firms to first specialize in narrower segments of GVCs and gradually expand into more production stages, grow their production scale, add more value, and earn higher profits. We believe this growth path may be especially important in emerging economies, where firms stand to gain more from knowledge transfer from foreign buyers and suppliers, and where the range, cost and quality of domestic inputs may initially be ill-suited to manufacturing products that meet the quality standards of foreign consumers and the technological needs of foreign downstream producers (Kugler and Verhoogen 2009).
Separately, financial frictions are also believed to impede growth in developing countries. Our results raise the possibility that GVCs make it possible for credit constrained firms to start by operating fewer production stages, accumulate retained earnings, and use internal capital to fund subsequent expansion along the supply chain. This resonates with earlier evidence that processing trade enables credit constrained firms to begin with intermediate assembly steps that have low liquidity needs, before progressing to ordinary trade where product design and marketing require more liquidity, but generate higher profits (Manova and Yu 2016).
The facts we have documented for the firm lifecycle in a world with GVCs point to potential macro-level implications that future work can explore. More broadly, we hope that this line of work provides a bridge between research by trade economists on GVC activity and research by development, industrial organization, and macro economists on growth and structural transformation.
(Davin Chor, Tuck School of Business, Dartmouth and NBER; Kalina Manova, University College London and CEPR; Zhihong Yu, University of Nottingham and GEP.)
References
Baldwin, Richard (2016), The Great Convergence: Information Technology and the New Globalization, Harvard University Press.
Chor, Davin, Manova, Kalina and Zhihong Yu (2021), “Growing like China: Firm Performance and Global Production Line Position,” Journal of International Economics (forthcoming).
Feenstra, Robert, and Shang-Jin Wei, ed. (2010), “China's Growing Role in World Trade,” University of Chicago Press.
Frankel, Jeffrey A. (2016), “Globalization and Chinese Growth: Ends of Trends?” Il Grande Sconvolgimento, ed.: Paolo Onofri, il Mulino.
IMF (2016), “Global Trade: What's Behind the Slowdown?” World Economic Outlook, Chapter 2.
Kugler, Maurice, and Eric Verhoogen (2009), “Plants and Imported Inputs: New Facts and an Interpretation,” American Economic Review Papers and Proceedings 99(2): 501-7.
Manova, Kalina, and Zhihong Yu (2016), “How Firms Export: Processing vs. Ordinary Trade with Financial Frictions,” Journal of International Economics 100: 120-137.
Manova, Kalina, and Zhihong Yu (2017), “Multi-Product Firms and Product Quality,” Journal of International Economics 109: 116-137.
World Development Report (2020), “Trading for Development in the Age of Global Value Chains,” World Bank Group.

Latest
Most Popular
- VoxChina Covid-19 Forum (Second Edition): China’s Post-Lockdown Economic Recovery VoxChina, Apr 18, 2020
- China’s Great Housing Boom Kaiji Chen, Yi Wen, Oct 11, 2017
- China’s Joint Venture Policy and the International Transfer of Technology Kun Jiang, Wolfgang Keller, Larry D. Qiu, William Ridley, Feb 06, 2019
- The Dark Side of the Chinese Fiscal Stimulus: Evidence from Local Government Debt Yi Huang, Marco Pagano, Ugo Panizza, Jun 28, 2017
- Wealth Redistribution in the Chinese Stock Market: the Role of Bubbles and Crashes Li An, Jiangze Bian, Dong Lou, Donghui Shi, Jul 01, 2020
- Evaluating Risk across Chinese Housing Markets Yongheng Deng, Joseph Gyourko, Jing Wu, Aug 02, 2017
- What Is Special about China’s Housing Boom? Edward L. Glaeser, Wei Huang, Yueran Ma, Andrei Shleifer, Jun 20, 2017
- Privatization and Productivity in China Yuyu Chen, Mitsuru Igami, Masayuki Sawada, Mo Xiao, Jan 31, 2018
- Daily Price Limits and the Magnet Effect Ting Chen, Zhenyu Gao, Jibao He, Wenxi Jiang, Wei Xiong, Oct 25, 2017
- How did China Move Up the Global Value Chains? Hiau Looi Kee, Heiwai Tang, Aug 30, 2017


