A Bridge on Economic Issues between China and the World


 Facebook
  Twitter
  Instagram
 WeChat
  Email
Email Economic Growth — in the World and in China

Convergence forces suggest that China’s per capita GDP growth rate will decline gradually from around 7% per year to the world’s historical average of 2%. In the past, this convergence tendency was more than offset by China’s opening to markets, improved legal institutions and business regulations, increased investment rates, higher life expectancy, and reduced fertility—but the convergence force will ultimately dominate.
Lessons for China’s economic growth — past and future — can best be drawn by studying the determinants of growth for many countries over long periods of time. These determinants can be studied within an empirical framework derived from the neoclassical growth model, which goes back to Ramsey (1928) and Solow (1956). The theoretical model exhibits a convergence property, whereby poor countries tend to grow faster than rich ones and, therefore, tend to converge over time toward rich countries’ levels of per capita GDP. This convergence property arises because of diminishing returns to investments in physical and human capital and — in later versions of the mode — to the ability of poor countries to imitate the technological innovations developed in more advanced countries.
Economists have known for some time that convergence holds empirically only in a conditional sense. Specifically, poor countries tend to grow rapidly only if they first create reasonably well-functioning legal and political institutions, implement some aspects of a regulatory structure amenable to market forces, provide a conducive setting for investments in human capital, and so on. The empirical implementation of this conditional-convergence idea began in the early 1990s (Barro [1991]; Mankiw, Romer, and Weil [1992]; Barro and Sala-i-Martin [1995]) and was updated in Barro (2015).
I recently applied this conditional-convergence framework to 85 countries, using the Penn-World Tables 9.0 data on real per capita GDP over 5-year periods from 1960 to 2014. (The PWT9 data are described in Feenstra, Inklaar, and Timmer [2015].) One finding is that the estimated rate of conditional convergence is 2-3% per year. That is, holding constant an array of explanatory variables, the estimated effect of the prior level of per capita GDP (measured on a proportionate scale) on the annual growth rate involves a coefficient of -0.02 to -0.03. This relationship is depicted in Figure 1. The array of other explanatory variables held constant in this diagram includes life expectancy (a measure of health), the fertility rate (a major influence on population growth), educational attainment, institutional quality (gauged by maintenance of rule of law and law & order), the World Bank’s overall measure of the ease of doing business, an indicator of democracy, international openness, shifts in the terms of trade, and the inflation rate.
Figure 1: Conditional Convergence
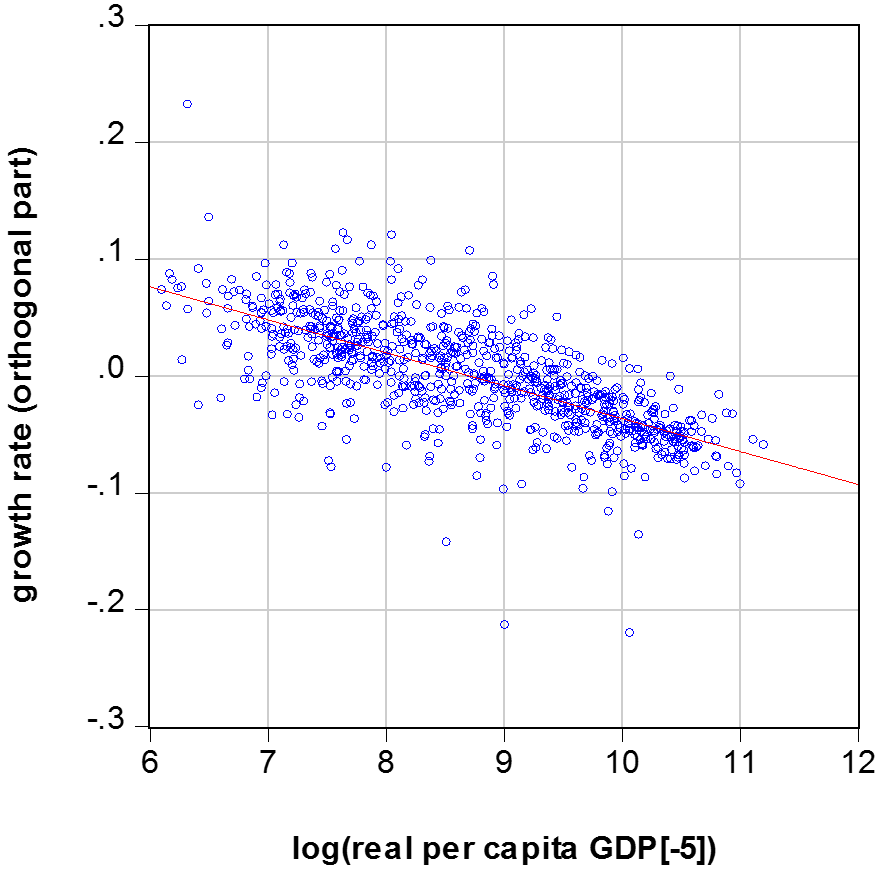
Table 1: China’s Growth Rates of Per Capita Real GDP
Actual and Model-Fitted
| (1) | (2) | (3) | (4) |
| Period | Actual Growth | Estimated Growth | Residual |
| 1960-1965 | 0.003 | 0.033 | -0.029 |
| 1965-1970 | 0.018 | 0.040 | -0.022 |
| 1970-1975 | 0.016 | 0.049 | -0.033 |
| 1975-1980 | 0.028 | 0.052 | -0.024 |
| 1980-1985 | 0.069 | 0.047 | 0.021 |
| 1985-1990 | 0.009 | 0.057 | -0.048 |
| 1990-1995 | 0.072 | 0.059 | 0.013 |
| 1995-2000 | 0.037 | 0.063 | -0.026 |
| 2000-2005 | 0.089 | 0.072 | 0.018 |
| 2005-2010 | 0.080 | 0.063 | 0.017 |
| 2010-2015 | 0.070 | 0.055 | 0.015 |
| 2015-2020 | -- | 0.047 | -- |
Table 1 applies the overall estimated model to the growth experience of China since 1960. The five-year periods are in column 1, the actual growth rate of per capita GDP is in column 2, the model fitted growth rate is in column 3, and the model residual is in column 4.
Throughout the sample, the rise in China’s per capita GDP predicts, by itself, a slowing down of growth through the convergence effect. However, this force is offset by changes in the explanatory variables. For example, the predicted growth rate rises throughout because of higher life expectancy, through 2000 because of lower fertility, through 2005 due to greater international openness (which subsequently turns downward), through 2010 because of a higher ratio of investment to GDP, and up to 1995-2000 due to better law & order (which worsens thereafter). The improved ease of doing business according to the World Bank indicator contributes to higher estimated growth from 2006 (the first year in which a comprehensive measure was constructed) to the present.
From 1960 to 1980, the combined effect from the convergence force and the changes in the explanatory variables is a rise in the model’s fitted growth rate from 3.3% per year to 5.2% (Table 1, column 3). That is, the convergence force was more than offset by favorable changes in the explanatory variables. However, the actual growth rates (column 2) fell well short of the predicted values during this period. A reasonable interpretation is that the model omits some aspects of the Chinese communist system that were adverse for economic growth through the late 1970s. For example, two disastrous political shocks specific to China — The Great Leap Forward of 1958-63 and the Cultural Revolution of 1966-76 — hindered growth.
Table 1, column 3, shows that China’s fitted per capita growth rate increases to 7.2% per year for the 2000-05 period. After 2005, however, the fitted value falls — partly because the convergence force strengthens due to the sharply rising per capita GDP and partly because the changing explanatory variables (some of which began to move adversely) provide less of an offsetting effect.
For the 2010-15 period, the fitted growth rate is down to 5.5%, and this decline continues to 4.7% for the forecast period of 2015-20. One way to look at this pattern is that the convergence force, which reflects rising per capita GDP ultimately has to win out against the combined offsets from the explanatory variables. These offsets eventually tend to be capped — because of limits to rising life expectancy, falling fertility, rising international openness, improving rule of law and ease of doing business, and so on.
Table 1, columns 2-4, shows that, since 1990, China’s per capita growth rate surpassed the model’s fitted value in four of the five periods. Overall, China grew 0.7% per year faster on average from 1990 to 2015 than would have been predicted from the global experience.
Based on information through 2015, China’s projected per capita growth for 2015-20 is 4.7% per year. (Since the recent population growth rate is around 0.5% per year, the implied growth rate of the level of real GDP is 5.2% per year.) Of course, it is possible that China will continue to grow faster than predicted beyond 2015. Notably, the actual per capita growth rate for 2016 is 6.2%. In the long run, however, the iron law of convergence should dominate. China’s per capita growth rate will most likely fall gradually after 2020 toward the world average rate, which historically has been around 2% per year.
(The author is Paul M. Warburg Professor of Economics at Harvard University and a Senior Fellow of Stanford University’s Hoover Institution.)
References
Barro, Robert J. (1991), “Economic Growth in a Cross Section of Countries,” Quarterly Journal of Economics, 106 (2), 407-443.
Barro, Robert J. (2015), “Convergence and Modernization,” Economic Journal, 125 (585), 911-942.
Barro, Robert J. and Xavier Sala-i-Martin (1995), Economic Growth, 1st ed., Cambridge MA, MIT Press.
Feenstra, Robert C., Robert Inklaar, and Marcel P. Timmer (2015), “The Next Generation of the Penn World Table,” American Economic Review, 105 (10), 3150-3182, available for download at ggdc.net/pwt.
Mankiw, N. Gregory, David Romer, and David N. Weil (1992), “A Contribution to the Empirics of Economic Growth,” Quarterly Journal of Economics, 107 (2), 407-437.
Ramsey, Frank (1928), “A Mathematical Theory of Saving,” Economic Journal, 38 (152), 543-559.
Solow, Robert M. (1956), “A Contribution to the Theory of Economic Growth,” Quarterly Journal of Economics, 70 (1), 65-94.

Latest
Most Popular
- VoxChina Covid-19 Forum (Second Edition): China’s Post-Lockdown Economic Recovery VoxChina, Apr 18, 2020
- China’s Great Housing Boom Kaiji Chen, Yi Wen, Oct 11, 2017
- China’s Joint Venture Policy and the International Transfer of Technology Kun Jiang, Wolfgang Keller, Larry D. Qiu, William Ridley, Feb 06, 2019
- The Dark Side of the Chinese Fiscal Stimulus: Evidence from Local Government Debt Yi Huang, Marco Pagano, Ugo Panizza, Jun 28, 2017
- Wealth Redistribution in the Chinese Stock Market: the Role of Bubbles and Crashes Li An, Jiangze Bian, Dong Lou, Donghui Shi, Jul 01, 2020
- What Is Special about China’s Housing Boom? Edward L. Glaeser, Wei Huang, Yueran Ma, Andrei Shleifer, Jun 20, 2017
- Evaluating Risk across Chinese Housing Markets Yongheng Deng, Joseph Gyourko, Jing Wu, Aug 02, 2017
- Privatization and Productivity in China Yuyu Chen, Mitsuru Igami, Masayuki Sawada, Mo Xiao, Jan 31, 2018
- How did China Move Up the Global Value Chains? Hiau Looi Kee, Heiwai Tang, Aug 30, 2017
- China’s Shadow Banking Sector: Wealth Management Products and Issuing Banks Viral V. Acharya, Jun Qian, Zhishu Yang, Aug 09, 2017


