A Bridge on Economic Issues between China and the World


 Facebook
  Twitter
  Instagram
 WeChat
  Email
Email How Did the US-China Trade War Affect American Communities?

The US-China trade war—the unprecedented tit-for-tat increase in tariffs by the US and China—provided a unique laboratory to study and understand how changes in trade policy can redistribute the gains from trade. I argue that the trade war induced concentrated losses in consumption and employment for American communities most exposed to Chinese retaliatory tariffs.

What are the costs of the trade war? The trade war affects welfare through two mechanisms. Trade benefits consumersthrough lower prices and increased variety. In the context of the US-China trade war, the expectation is that US tariffs on Chinese goods will impose hardship on all US consumers through higher prices and a reduction in variety. This prediction is becoming apparent as Fajgelbaum, Goldberg, Kennedy, and Khandelwal (2019), Amiti, Redding, and Weinstein (2019), and Cavallo, Gopinath, Neiman, and Tang (2019) find that US tariffs are leading to higher prices and a reduction in welfare for all consumers.
From a US workers’ perspective, there is a second hardship of the trade war: retaliatory Chinese tariffs on US exports affect labor income and/or production opportunities for those directly impacted, for example, farmers or workers engaged in agriculture and manufacturing production that China targeted with retaliatory tariffs (see Note 1). Unlike the price effects—which are spread widely across the US population—this “labor-income channel” is concentrated. That is, those who had a position of comparative advantage for the Chinese market and lost it due to tariffs bear this burden of the trade war alone.Measuring the consumption response to trade shocks. In Waugh 2019, I focus on this second hardship and measure the effect of retaliatory Chinese tariffs on county-level consumption and labor market outcomes. The research design is simple: I exploit variation in a county’s exposure to Chinese retaliatory tariffs on US products between 2017 and 2018 and correlate it with changes in consumption at the county level. The focus on Chinese tariffs on US products stems from a desire to measure a trade-induced change in labor income/production opportunities, for example, soybean farmers in Iowa who lose the ability to sell their product due to Chinese retaliation.
The focus on consumption is a unique aspect of my work. Most research focuses on trade-induced labor market outcomes, for example, the seminal work of Autor, Dorn, and Hanson (2013). From a welfare perspective, however, labor market outcomes may not reflect how economic welfare is allocated across those who are differentially impacted by trade. Evidence on the response of consumption is important becausethe consumption response reveals the extent to which households can adjust to trade shocks. For example, if consumption does not change much—even though trade negatively affects the labor market—this suggests that these shocks are insurable, and hence the distributional consequences and welfare losses associated with exposure to trade are small. In contrast, if consumption changes a lot, this suggests that labor market consequences are passing through to consumption, and hence there are important distributional consequences for welfare associated with trade.
While studying consumption has many appealing features, measuring consumption at the microeconomic level is, in general, difficult. My approach to measuring consumption is to use a unique data set with the universe of new auto sales at the US county level, at a monthly frequency. This data set allows me to proxy consumption behavior with purchases of an easily defined object, and variation at both a narrow geographic dimension and at high frequency. High frequency is important in this context, due to the rapidly changing nature of trade policy during 2018.
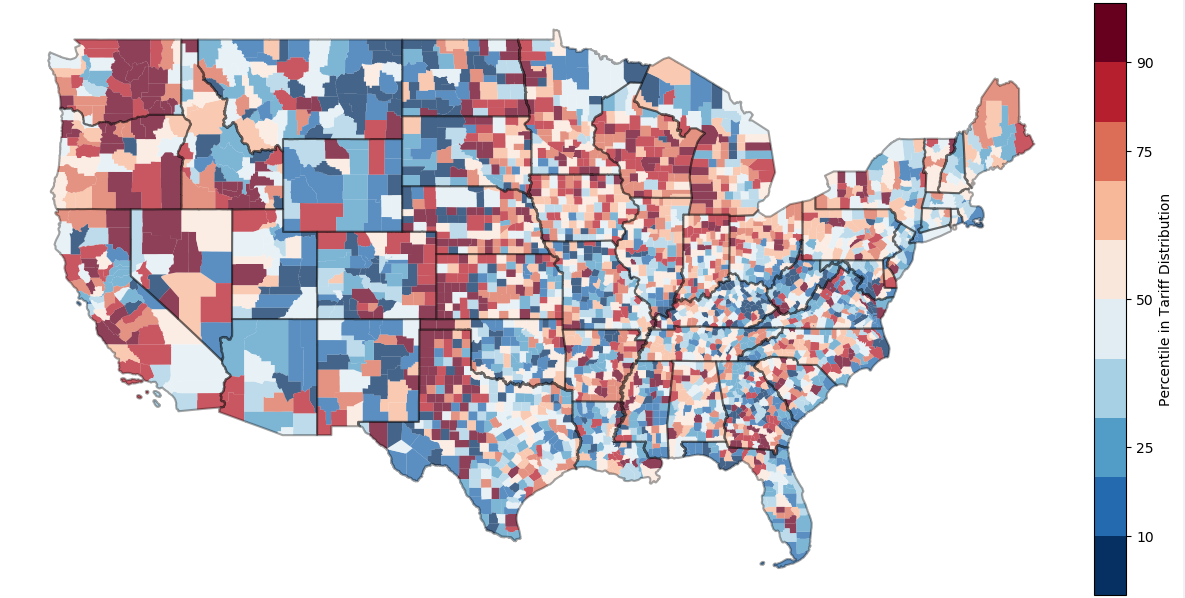
The unequal burden of the trade war. Figure 1 illustrates that the burden of Chinese retaliation is concentrated. It plots the change in the tariff a county faces to export to China (which is an employment weighted average of the retaliatory tariff at the sectoral level) between December 2017 and December 2018. A county is colored according to its position within the distribution across counties: red indicates that thecounty’s tariff increased a lot and blue indicates that thecounty’s tariff did not increase that much (see Note 2).
Figure 1: Tariff Exposure by County in the Continental US
US County Tarrif Exposure to China (as of Dec 2018)
Those bearing the burden of the trade war suffered. Both visually and through formal econometric specifications, I find that changes in trade policy had large effects on consumption, with high-tariff counties experiencing between a 2 and 4 percentage point decline in new auto sales growth relative to low-tariff counties.
County-Level, New Auto Sales Growth by Tariff Change
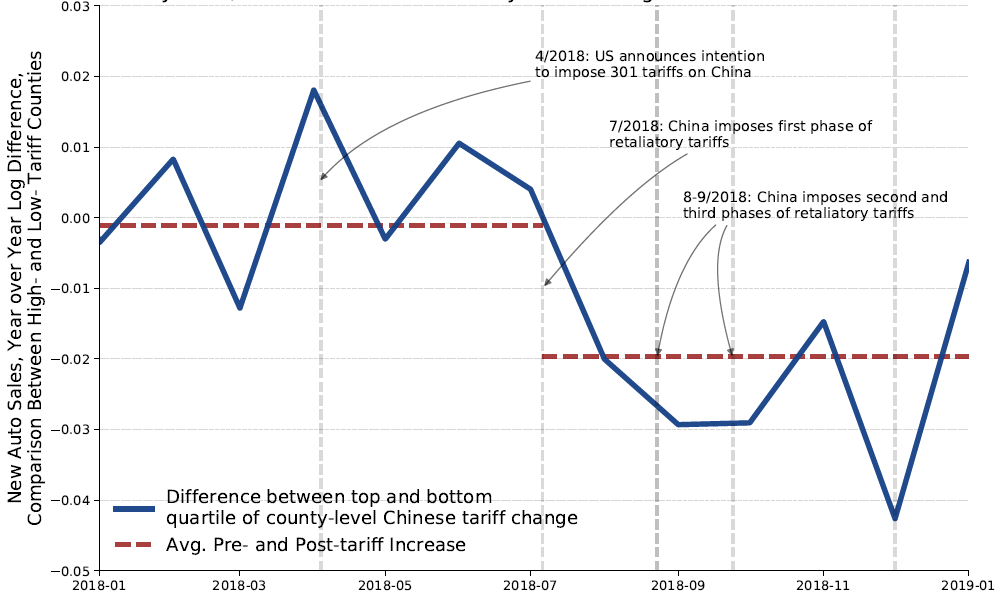
This simplest way to arrive at these conclusions is to compare auto sales growth in counties that had large increases in tariffs versus those that had small increases in tariffs. Here high versus low is a comparison of counties in the upper quartile of the change-in-tariff distribution and those in the lower quartile, as of December 2018, that is, the dark red areas of Figure 1 versus the blue areas.
Figure 2 plots this comparison between January 2018 and January 2019. Dashed vertical lines (with annotation) indicate important events during the trade war. Units on the y-axis are in log points, so an interpretation of the value of 0.01 is a 1 percentage point difference in annual growth rates. The figure shows that prior to the implementation of tariffs in July 2018, there wasno difference in auto sales growth between high- and low-tariff counties. A difference immediately emerges after the implementation of the first round of tariffs in July 2018. For the second half of 2018, high-tariff counties grew slower relative to low-tariff counties. The magnitude is large, with a 2 percentage point difference. In words, consumption in high-tariff counties grew 2 percentage points slower after the implementation of the tariffs.In formal econometric specifications, I find that the elasticity of consumption growth to tariffs to be robustly around -1. That is, a 1 percentage point increase in a county’s exposure to Chinese retaliatory tariffs leads to a 1 percentage point decrease in auto sales growth. In terms of magnitudes, this elasticity implies a nearly 3.8 percentage point decline in auto sales growth for counties in the upper quartile of the tariff distribution relative to counties in the lower quartile.
These consumption losses are connected with negative labor market outcomes. Using monthly datafrom the US Bureau of Labor Statistics’ Quarterly Census of Employment and Wages, I find that total employment growth declines by 1percentage point for counties in the upper quartile of the tariff distribution. More intriguing is that retail employment declines by a similar magnitude. The decline in retail employment suggests that through county-level equilibrium effects (see, for example, Mian and Sufi 2014), consumption, and local demand conditions are softening for the communities most affected by Chinese tariffs.
Two different back-of-the envelope calculations suggest these effects are economically meaningful. Under an assumption that estimated relative effects are the same as absolute effects, the auto estimates imply a decrease in aggregate consumption of up to $54 billion. Moreover, this effect is concentrated with high-tariff counties experiencing a $1,600 per worker decrease in aggregate consumption. As a lower bound, the retail employment estimates imply a decrease in aggregate consumption of $20 billion and$630 per worker for those in high-tariff counties.
Why? What now? Overall, the employment effects connect well with the reductions in consumption. That is, for counties thatwere more exposed to Chinese retaliatory tariffs, the tariffs reduced theability to export, whichfed into the labor market (both tradable and non-tradable), and thus reduced consumption.
With that said, there are some open questions as to why? In my results, evidence suggests that something beyond the labor market is behind the fall in consumption. The role of expectations and uncertainty are primary culprits. To tease this out, a formal economic model is probably needed—in particular, one that takes into account the durable nature of consumption in the data and examines the idea that expectations play an important role.
A related question regards the broader effects of the trade war. Currently, my work studies only the effects of Chinese retaliatory tariffs on consumption; it does not measure the potential benefits that US tariff protection may have afforded certain import-competing American communities. My work also focuses onlyon the direct effects of retaliatory tariffs, not the indirect effects that US tariff protection may have had on US exporters through supply chains and intermediates (see, for example, Handley, Kamal, and Monarch 2020).
A final, more pressing question is what is going on now. The Phase One agreement signed between the US and China on January 15, 2020, included large Chinese commitments to purchase US goods and services (see Note 4). Will these commitments be met, especially with the potential economic damage from the COVID-19 pandemic? And if these commitments are met, will they reverse the harm that the trade war imposed on segments of the US population? Answers to these questions are critical to providing a complete picture ofthe economic costs of the trade war.
Note 1: Currently, I abstract from the reverse effect of US tariffs, that is, the potential benefits that U S tariff protection may have afforded certain import-competing American communities; future revisions will address this issue.
Note 2: An interactive map displaying county-level results can be found at https://www.waugheconomics.com/trade-war-map.html.
Note 3: Casual observation suggests that counties facing the most retaliation are also the counties thatvoted more strongly for President Trump in the 2016 US election. In a formal regression analysis, I do find that relationship, however, most of the variation in tariff retaliation is explained by a county’s export exposure to China in the past.
Note 4: The text of the Phase One agreement is available at https://ustr.gov/sites/default/files/files/agreements/phase%20one%20agreement/US_China_Agreement_Fact_Sheet.pdf.
(Michael E. Waugh is the William R. Berkley Term Professor of Economics and Business at New York University.)
References
Amiti, Mary, Stephen J. Redding, and David Weinstein. 2019. “The Impact of the 2018 Trade War on US Prices and Welfare.” NBER Working Paper No. 25672. https://www.nber.org/papers/w25672.
Autor, D., D. Dorn, and G. H. Hanson.2013. “The China Syndrome: Local Labor Market Effects of Import Competition in the United States,” American Economic Review 103, no.6 (October):2121–68. https://doi.org/10.1257/aer.103.6.2121.
Cavallo, Alberto, Gita Gopinath, Brent Neiman, and Jenny Tang.2019. “Tariff Passthrough at the Border and at the Store: Evidence from US Trade Policy,” NBER Working Paper No. 26396. https://www.nber.org/papers/w26396.Fajgelbaum, Pablo D., Pinelopi K. Goldberg, Patrick J. Kennedy, and Amit K. Khandelwal. 2019. “The Return to Protectionism.” NBER Working Paper No. 25638. https://www.nber.org/papers/w25638.
Handley, Kyle, Fariha Kamal, and Ryan Monarch. 2020. “Rising Import Tariffs, Falling Export Growth: When Modern Supply Chains Meet Old-Style Protectionism.” NBER Working Paper No. 26611. https://www.nber.org/papers/w26611.
Mian, Atif, and Amir Sufi. 2014. “What Explains the 2007–2009 Drop in Employment?” Econometrica 82, no.6 (November):2197–2223. https://doi.org/10.3982/ECTA10451.
Waugh, Michael E. 2019. “The Consumption Response to Trade Shocks: Evidence from the US-China Trade War.” NBER Working Paper No. 26353. https://www.nber.org/papers/w26353.

Latest
Most Popular
- VoxChina Covid-19 Forum (Second Edition): China’s Post-Lockdown Economic Recovery VoxChina, Apr 18, 2020
- China’s Great Housing Boom Kaiji Chen, Yi Wen, Oct 11, 2017
- China’s Joint Venture Policy and the International Transfer of Technology Kun Jiang, Wolfgang Keller, Larry D. Qiu, William Ridley, Feb 06, 2019
- The Dark Side of the Chinese Fiscal Stimulus: Evidence from Local Government Debt Yi Huang, Marco Pagano, Ugo Panizza, Jun 28, 2017
- Wealth Redistribution in the Chinese Stock Market: the Role of Bubbles and Crashes Li An, Jiangze Bian, Dong Lou, Donghui Shi, Jul 01, 2020
- Evaluating Risk across Chinese Housing Markets Yongheng Deng, Joseph Gyourko, Jing Wu, Aug 02, 2017
- What Is Special about China’s Housing Boom? Edward L. Glaeser, Wei Huang, Yueran Ma, Andrei Shleifer, Jun 20, 2017
- Privatization and Productivity in China Yuyu Chen, Mitsuru Igami, Masayuki Sawada, Mo Xiao, Jan 31, 2018
- Daily Price Limits and the Magnet Effect Ting Chen, Zhenyu Gao, Jibao He, Wenxi Jiang, Wei Xiong, Oct 25, 2017
- How did China Move Up the Global Value Chains? Hiau Looi Kee, Heiwai Tang, Aug 30, 2017


