A Bridge on Economic Issues between China and the World


 Facebook
  Twitter
  Instagram
 WeChat
  Email
Email Price Discovery and Market Segmentation in China’s Credit Market

The recent unprecedented wave of bond defaults in China has captured the attention of investors worldwide. We document a severe segmentation between the pricing of state-owned enterprise (SOE) and non-SOE bonds that arises sharply post 2018. Using our default measure, we find that this market segmentation is not driven by the fundamentals of the firms. We also show that this market segmentation has also caused a segmentation in price discovery— the pricing of non-SOE bonds becomes more efficient amidst market turmoil.

Focusing on the onshore Chinese corporate bond market, we study (http://en.saif.sjtu.edu.cn/junpan/Credit.pdf) the extent of its price efficiency and the information content of credit spreads in China. Central to our analysis is a measure of credit quality for bond issuers. For this, we base our analysis on the default model of Merton (1974) and focus on the corporate bonds issued by publicly listed firms to take advantage of their publicly available information. Specifically, we measure each issuer’s credit quality using Merton’s model, with the firm’s quarterly financial statements and daily stock prices as the main inputs to the model. Our default measure, the inverse of Merton’s distance to default, is higher for firms with lower credit quality.
We find that only after the first default in 2014 do credit spreads in China become informative. We also find that the presence of outside government support for SOEs in China results in a market segmentation between SOE and non-SOE issuers that is harmful to price efficiency and market stability. Since 2018, non-SOE issuers have suffered from explosive credit spreads, unprecedented defaults, and shrinking new issuances, while the SOE issuers have remained relatively intact. Meanwhile, our default measures show that the non-SOE issuers are in fact stronger in credit quality than their SOE counterparts of the same rating category. By examining the impact of this segmentation on price discovery, we find that non-SOE credit spreads have become significantly more informative since 2018, as concerns over credit have become front and center for the non-SOE issuers. In contrast, as investors seek safety in SOE bonds, there is no improvement in the information content of SOE credit spreads.
From 2008 through 2018, domestic debt securities issued by China’s non-financial companies increased by $2.795 trillion, from a negligible level in 2008 to $3 trillion in 2018, second only to the US. As China further opens up its financial system, this onshore credit market has the potential to become a key component of the global fixed-income market, offering prospective international investors exposure to the real economy of China. If the rapid growth of China’s economy has been the story of our age for the past three decades, then, moving forward, the maturation of China’s financial markets and their integration into the global markets could very well be the story of the coming decade.
The development of China’s credit market can be divided into three phases. During Phase I, prior to 2014, China’s credit market had no default events, with the widespread belief that bond investors would always be paid in full. Using quarterly panel regressions of credit spreads on credit measures and controlling for credit ratings and other bond characteristics, our result shows that prior to 2014, credit spreads bear no statistically significant relation with the default measures. For the US market, controlling for credit ratings, a significant portion of the variation in credit spreads can be explained by issuer-level variables known to affect the credit quality of a firm. (Collin-Dufresne et al. (2001); Campbell and Taksler (2003); Bao et al. (2011)).
Figure 1
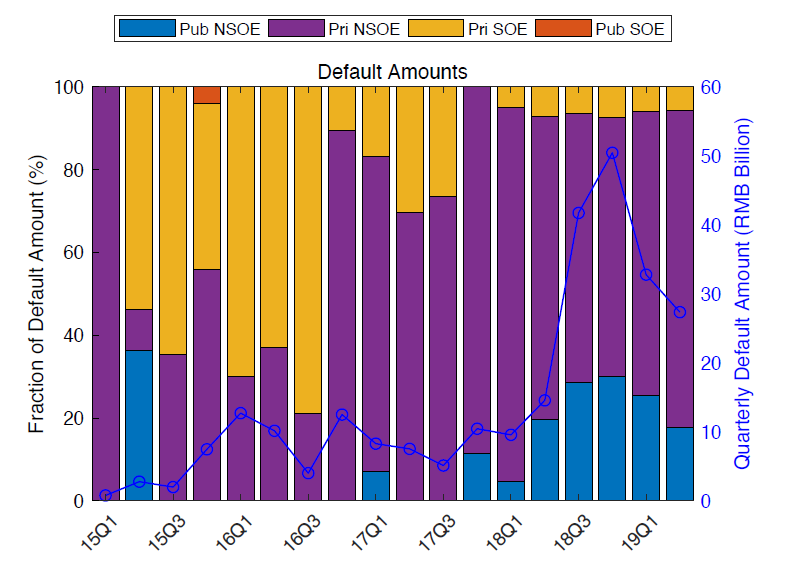
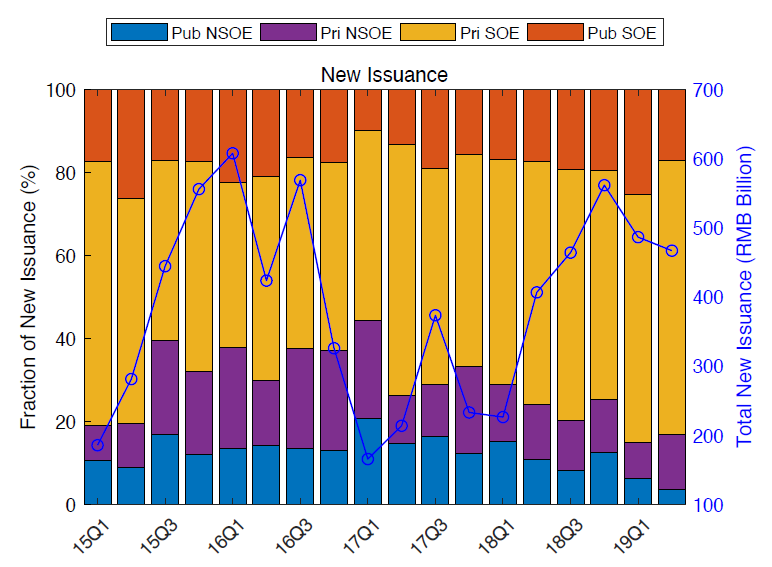
Note: The top panel plots the quarterly default amount(right axis) and the fraction by issuer type (left axis). Default by all instruments in the credit market are included. The bottom panel plots quarterly new issuance of corporate bonds (right axis) and the fraction by issuer type (left axis). Corporate bonds issued by Chengtou are excluded.
During Phase II, as the credit market grew out of the pre-default era, we see an improvement in the information content of credit spreads in China. As shown in the top panel of Figure 1, from 2014 to 2018Q1, the first wave of defaults occurred mostly in privately held firms, but its impact was felt in the pricing of bonds issued by public firms. Repeating the same panel regression for this time period, we find a statistically significant relation between credit spreads and default measures, indicating that as defaults started to occur, concerns over credit risk began to take hold and find their way into bond pricing. Controlling for ratings, a one standard deviation increase in our default measure translates to an increase in credit spread of about 15 bps.The adjusted R-squared of the panel regression remains the same after the inclusion of the default measures, while, for the US market, the default measures can explain as much as 45% of the variation in credit spreads in the US market (Bao 2009). Therefore, the explanatory power of the default measure remains rather limited.
During Phase III, the most significant development documented in our paper is the severe segmentation between the non-SOE and SOE issuers triggered by the rapid tightening of credit conditions in China. From 2018Q2 through 2019, the credit market in China experienced a second and much more severe wave of defaults. The significance of this second wave of defaults is that public non-SOE issuers were severely hit during this period. At the peak in 2018Q4, public non-SOEs accounted for 30% of the total default amount in the credit market. At the same time, the public SOE issuers remained mostly intact. There are two potential explanations for the origin of this wave of credit-market stress. One possibility relates to the sequence of credit-tightening policies and the overall macro-economic conditions in China. The second, and potentially more fundamental and convincing explanation, is related to the poor corporate governance, weak fundamentals, over-borrowing and over-expansion in many non-SOEs post 2014.
Figure 2
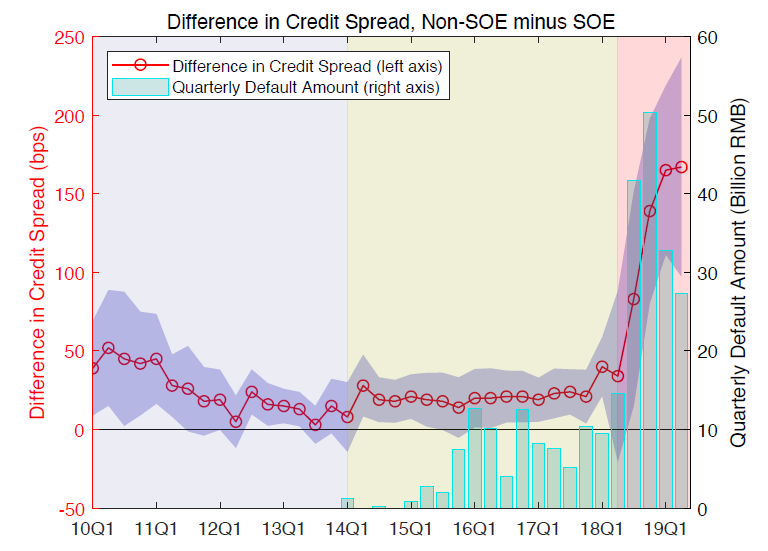
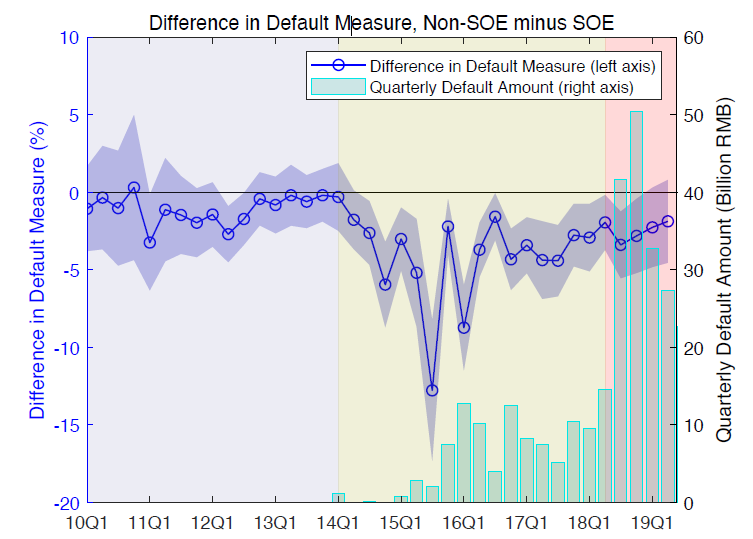
Note: This Figure plots the difference between public non-SOEs and public SOEs in credit spread (top level, left axis) and in default measure (bottom panel, left axis), estimated using quarterly regressions, controlling for credit ratings and other bond and firm characteristics. The shaded area indicates the 95% confidence intervals. Also reported are the total quarterly default amounts in the credit market (right axis). The vertical dashed line marks the release of New Regulations on Asset Management.
As shown in Figure 2, controlling for credit ratings and other bond and firm characteristics, the difference in credit spreads between non-SOE and SOE bonds fluctuated around an average level of 20 bps prior to 2018Q2, indicating a moderate premium enjoyed by SOE issuers because of their perceived outside government support. After 2018, this premium doubled to 40 bps during the first two quarters, and then exploded quickly to 90 bps in 2018Q3, 140 bps in 2018Q4, and 167 bps in 2019Q1. This segmentation between non-SOE and SOE bonds occurred not only for public firms but also private firms.
Moreover, this market segmentation between non-SOE and SOE is not driven by the fundamentals of the firms. Using our default measures, we find that the SOEs are in fact weaker in credit quality than their non-SOE counterpart in the same rating category. As the bottom panel in Figure 2 shows, prior to the 2014 default, the difference in default measure between the SOE and non-SOE samples was economically small and of marginal statistical significance. After the first default in 2014, the default measures of these two samples of firms started to diverge, with non-SOEs becoming significantly healthier than their SOE counterparts. In other words, as investors became more mindful of credit risk, the non-SOE issuers compensated for their lack of outside government support by providing healthier balance sheets and better-performing stocks. As the credit market condition worsened in 2019, however, the difference in credit quality between these two samples started to shrink steadily, pointing to the possibility that the credit-market stress caused by market segmentation has begun to hurt the balance sheets and equity performance of the non-SOEs.
Finally, this market segmentation has also caused a segmentation in price discovery. Repeating the same quarterly panel regressions from 2018Q2 to 2019Q2, we find a marked improvement in the information content of non-SOE credit spreads. A one standard deviation increase in the default measure is associated with a widening of the credit spread on the order of 165 bps. Moreover, the inclusion of our default measures also improves the explanatory power for credit spreads by 6.2% in adjusted R-squared. This result is consistent with the observation that, during this severe segmentation, investors are forced to be more discriminating against the non-SOE bonds because of their perceived vulnerability.
Overall, our empirical results contribute to the existing literature by offering insights into a young but important market that is very much in transition. While the information content of credit spreads has been widely studied and documented for the mature US credit market, our understanding of credit spreads in China remains rather limited. Our paper is the first to document the improving informativeness of credit spreads in China after the first default in 2014. Our paper is also the first to document the segmentation between non-SOE and SOE issuers in the Chinese credit market. Our results show that while the segmentation remains mostly dormant during calm market conditions, it has the potential of breaking open rather rapidly and threatening the stability of the market. Moreover, the presence of the severe segmentation also has a differing impact on market efficiency—the pricing of non-SOE bonds becomes more efficient amidst market turmoil, while there is no improvement in the pricing of SOE bonds as investors seek safety in such bonds.
(Zhe Geng, Shanghai Advanced Institute of Finance, Shanghai Jiao Tong University; Jun Pan, Shanghai Advanced Institute of Finance, Shanghai Jiao Tong University, CAFR and NBER.)
References:
Bao, J. (2009). Structural Models of Default and the Cross-Section of Corporate Bond Yield Spreads. Working paper.
Bao, J., J. Pan, and J. Wang (2011). The Illiquidity of Corporate Bonds. Journal of Finance 66(3), 911–946.
Campbell, J. Y. and G. B. Taksler (2003). Equity Volatility and Corporate Bond Yields. Journal of Finance 58(6), 2321–2349.
Collin-Dufresne, P., R. S. Goldstein, and J. S. Martin (2001). The Determinants of Credit Spread Changes. Journal of Finance 56(6), 2177–2207.
Merton, R. C. (1974). On the Pricing of Corporate Debt: The Risk Structure of Interest Rates. Journal of Finance 29(2), 449–470.

Latest
Most Popular
- VoxChina Covid-19 Forum (Second Edition): China’s Post-Lockdown Economic Recovery VoxChina, Apr 18, 2020
- China’s Great Housing Boom Kaiji Chen, Yi Wen, Oct 11, 2017
- China’s Joint Venture Policy and the International Transfer of Technology Kun Jiang, Wolfgang Keller, Larry D. Qiu, William Ridley, Feb 06, 2019
- The Dark Side of the Chinese Fiscal Stimulus: Evidence from Local Government Debt Yi Huang, Marco Pagano, Ugo Panizza, Jun 28, 2017
- Wealth Redistribution in the Chinese Stock Market: the Role of Bubbles and Crashes Li An, Jiangze Bian, Dong Lou, Donghui Shi, Jul 01, 2020
- Evaluating Risk across Chinese Housing Markets Yongheng Deng, Joseph Gyourko, Jing Wu, Aug 02, 2017
- What Is Special about China’s Housing Boom? Edward L. Glaeser, Wei Huang, Yueran Ma, Andrei Shleifer, Jun 20, 2017
- Privatization and Productivity in China Yuyu Chen, Mitsuru Igami, Masayuki Sawada, Mo Xiao, Jan 31, 2018
- Daily Price Limits and the Magnet Effect Ting Chen, Zhenyu Gao, Jibao He, Wenxi Jiang, Wei Xiong, Oct 25, 2017
- How did China Move Up the Global Value Chains? Hiau Looi Kee, Heiwai Tang, Aug 30, 2017


