A Bridge on Economic Issues between China and the World


 Facebook
  Twitter
  Instagram
 WeChat
  Email
Email Can Investment Incentives Crowd Out Innovation? Evidence from China

The Chinese government has been using strong fiscal stimuli to encourage investment. While these fiscal policies, such as investment tax credits, often encourage firm investment, we find that investment tax incentives may generate an unintended reduction of firms’ innovation. Moreover, the crowding-out effect is non-monotonic in the level of financial constraints.

Ke et al. (2019) document a crowding-out effect of the 2004 VAT reform — investment tax incentives may generate an unintended reduction of firms’ innovation. Moreover, the effect is non-monotonic in the firms’ level of financial constraints. It is well-documented that firms’ innovation has a positive externality on the productivity of other firms, and hence on economic growth, through technology spillovers [see, for example, Romer (1986), Griliches (1991), Jones and Williams (1998), and Bloom, Schankerman, and Reenen (2013)]. Therefore, the crowding-out effect on firms’ innovation may lead to a negative externality on economic growth that firms do not internalize as they maximize profits.
How Does the VAT Reform Affect Firms with Different Financial Constraints?
We analyze the effects of investment tax credits in a simple model in which firms have heterogeneous production technologies and financial constraints and they may choose to upgrade their technologies; however, advanced technologies are associated with additional operating costs. The VAT reform reduces the costs of machines and equipment, and makes upgrading to the capital-intensive advanced technology more appealing. Nonetheless, not all firms prefer to upgrade. Firms with tight financial constraints will not find upgrading beneficial, since the additional costs associated with advanced technologies leave them insufficient funds for production. Firms with loose financial constraints can afford advanced technologies regardless of whether there is any cost reduction from the reform. In contrast, firms with intermediate-level financial constraints will take advantage of the reform to upgrade. To afford the additional costs, however, innovation will be crowded out. Note that while firms want to reduce innovation to maximize profits, reducing innovation will have a negative externality on economic growth that firms do not take into consideration. In addition to this non-monotonic crowding-out effect on innovation, our theoretical analysis also provides predictions about how the VAT reform affects fixed asset expenditures and labor costs and offers a unified explanation for previous empirical studies including, but not limited to, Liu and Lu (2015), Zhang, Chen, and He (2018), Liu and Mao (2019), and Cai and Harrison (forthcoming).
Empirical Analysis and the Non-monotonic Effects of the 2004 VAT Reform
The 2004 VAT reform targets firms in six industries located in three northeastern provinces in China. This allows us to exploit the difference-in-difference-in-differences (DDD) estimation for identification. That is, we first compare the before–after difference between industries targeted by the reform with those not targeted by the reform within the northeastern provinces (difference-in-differences or DID). Then, we compare such a DID between northeastern provinces and other provinces in China. In order for the DDD strategy to be valid, for example, the difference in the pre-existing time trends between targeted industries and non-targeted industries in the northeastern provinces needs to be the same as that in other provinces. Ke et al. (2019) provide evidence supporting this pre-assumption as well as evidence that other confounding events (e.g., the multifiber arrangement and concurrent stricter environmental policies) are not driving the main findings (see Note 1 for additional robustness checks).
Using the number of patents granted to firms as the primary measure of innovation activities and the sample covering 2001–2007, we find that the VAT reform has a significant negative effect on firms’ innovation. Column (1) in Table 1 shows the coefficient of the triple interaction term is -0.0082 and is statistically significant at the 5 percent level. Compared with other provinces, the difference between the before–after growth rate for patents developed by firms in targeted industries and that in non-targeted industries in the northeastern provinces is 9.51 percent lower (see Note 2 for more details). This result is robust across different regression specifications in Columns (2) to (4).
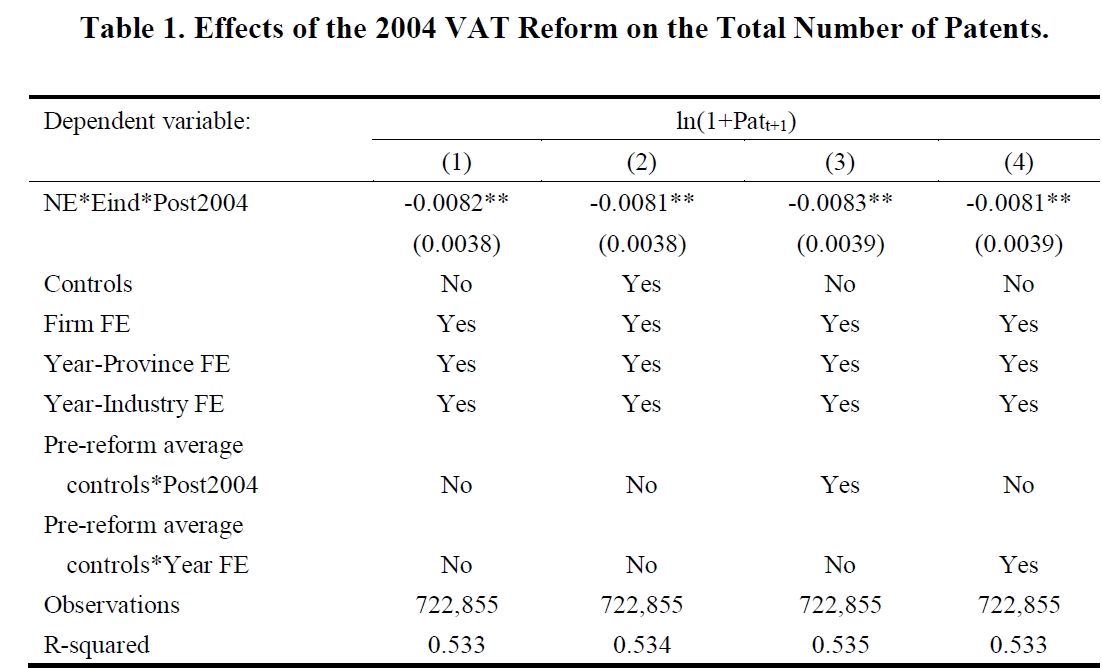
This table provides evidence on the effect of the 2004 VAT reform on the total number of patents applied for by a firm in year t+1 and eventually successfully granted [ln(1+Patt+1)]. NE is an indicator equal to one for the three provinces in the northeastern part of China and zero otherwise. Eind is an indicator equal to one for those six industries targeted by the reform and zero otherwise. Post2004 is also an indicator, which is equal to one for the years 2005–2007 and zero for years 2001–2004. Column (1) estimates the basic impact of the 2004 VAT reform on firm innovation. Column (2) controls for a set of firm-level time-variant variables including the logarithm of total assets, firm’s age, the return on the assets ratio defined as operating income divided by the book value of total assets, the proportion of capital owned by the foreign sector, and the proportion of capital owned by the state. The average values of these controls in Columns (3) and (4) are calculated across all firms in the pre-reform period. Column (3) interacts the Post2004 dummy with the pre-reform average controls. Column (4) fully controls for the interactions between year dummies and the pre-reform average controls. Standard errors clustered at the firm-level are in parentheses.
We investigate the heterogeneous effects of the VAT reform in terms of firms’ financial constraints. We follow Hadlock and Pierce (2010) to construct the size-and-age (SA) index to measure the extent to which each firm is financially constrained. A firm with a higher SA index is financially more constrained. Although originally estimated based on data for U.S. firms, it has been argued that the SA index is a good proxy for firms’ level of financial constraints in various contexts [see Hadlock and Pierce (2010) and Berkowitz, Lin, and Ma (2015)]. Previous research also confirms that both smaller firms and younger firms face tighter financial constraints in China, suggesting that the SA index can continue to be a reasonable proxy in China [see Cull and Xu (2005) and Liu and Mao (2019)]. In addition, we verify that our findings are robust under alternative proxies such as firm size and the cash flow ratio, which have been used in Liu and Mao (2019).
Table 2 divides firms into three groups according to the SA index. Firms with tight [Column (1)], intermediate-level [Column (2)], and loose [Column (3)] financial constraints belong to the top three, middle four, and bottom three deciles, respectively, of the SA index. Table 2 shows that the coefficient of the triple interaction is only significant for firms with intermediate-level financial constraints. It is equal to -0.0127, meaning that compared with other provinces, the difference between the before–after growth rate for patents developed by firms with intermediate-level financial constraints in targeted industries and that in non-targeted industries is 23.24 percent lower in northeastern provinces (see Note 3 for more details). Column (4) in Table 2 uses the whole sample and includes the interaction of the triple interaction term, NE*Eind*Post2004, as well as dummies that indicate intermediate-level and loose financial constraints. Again, its coefficient is significantly negative, confirming the heterogeneous effects of the VAT reform on firms’ innovation.
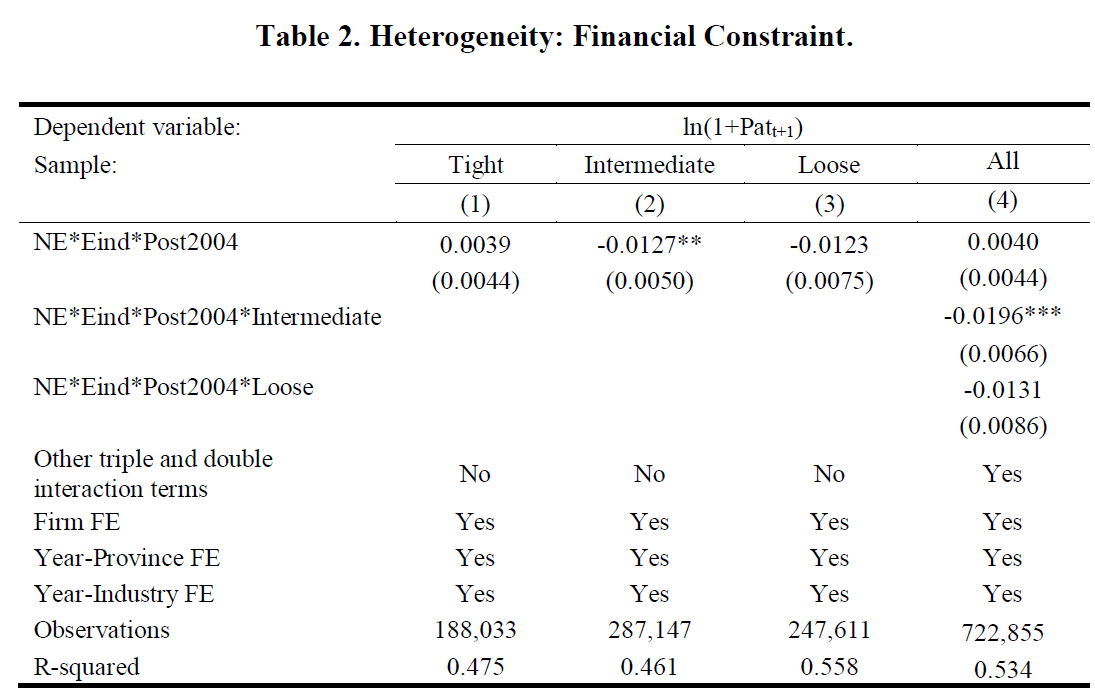
This table presents the heterogeneous effects of the 2004 VAT reform on the total number of patents applied for by a firm in year t+1 that were eventually successfully granted [ln(1+Patt+1)] by the financial constraint index (SA index). The average SA financial constraint index (Hadlock and Pierce, 2010) measured in the pre-reform years are used to divide our sample into deciles and define the top three deciles as tight, the middle four deciles as intermediate, and the bottom three deciles as loose financial constraints. Intermediate and Loose are two dummy variables based on the SA index to identify the groups of firms within the intermediate level (in the middle four deciles) and the loose level (in the bottom three deciles) of financial constraints, respectively. Robust standard errors clustered at the firm-level are reported in parentheses.
Finally, we show that the non-monotonic effects of the reform are not limited to innovation — firms’ labor costs (defined as the log value of total wages) are also non-monotonically (in the level of financial constraints) affected by the VAT reform as predicted by the model. In addition, we find that the effect of the reform on fixed asset expenditure is insignificant, consistent with our finding that the effect of the reform on fixed asset expenditure depends on the parameters of firms’ production functions. Specifically, as a firm upgrades its technology, the crowding out effect on fixed asset expenditure due to the additional cost associated with advanced technologies and the increase in firm’s capital intensity coexist; these two forces act in opposite directions.
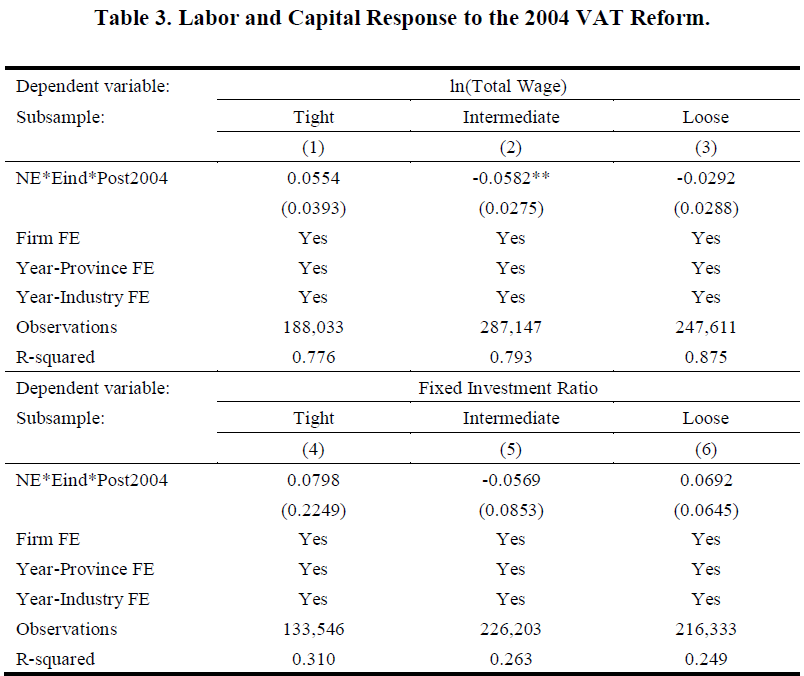
This table provides evidence on the heterogeneous effects of the 2004 VAT reform on firm-level labor costs and the fixed investment rate in terms of financial constraints proxied by the SA index. The dependent variables are the log value of total wage (in 1998 Renminbi) in Columns (1)–(3) and the gross fixed asset investment in a given year normalized by the lagged net fixed asset stock are in Columns (4)–(6). The three subsamples with different levels of financial constraints are constructed as in Table 2. Robust standard errors clustered at the firm-level are reported in parentheses.
Summary
Our research (Ke et al., 2019) suggests that investment tax credits may have unintended negative effects on firms’ innovation, thereby deepening our understanding about the role of financial constraints in this type of policy. Our findings on the crowding-out effects of investment tax credits on innovation are relevant for policymakers for designing optimal fiscal policies to improve innovation and boost economic growth. This is especially important for China — even with rapid economic growth, China has long been criticized for insufficient innovation. Promoting healthy economic growth motivated by innovation is crucial for long-term stable economic growth.
Note 1: We conduct other robustness checks to confirm the validity of our identification: (1) We use the propensity score matched sample to eliminate major differences between affected and unaffected ?rms and re-estimate the effects; (2) We conduct permutation tests to show that our results are not driven by random factors; (3) We verify that firms cannot predict a policy and change their behavior in advance; and (4) We show that neither trans-province production nor firm entries/exits drives our main results.
Note 2: Specifically,
 , and x represents the interaction among
  ,
,  , and
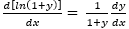
, and  . When we increase x from zero to one, dy = (1+y)ln(1+y). The change in the number of patents (dy) from its mean value (0.0944) during 2002–2008 is then equal to 0.0082×(1+0.0944) = 0.0090, which accounts for 9.51 percent of the mean value of the number of patents.
Note 3: Similar to Note 2, for firms with the intermediate level of financial constraints, the change in the number of patents from its mean value (0.0578) during 2002–2008 is then equal to 0.0127×(1+0.0578) = 0.0134, which accounts for 23.24 percent of the mean value of the number of patents.
(Shaowei Ke, assistant professor of economics at the University of Michigan; Yao Lu, associate professor in finance in the School of Economics and Management at Tsinghua University; Xinzheng Shi, associate professor in economics in the School of Economics and Management at Tsinghua University; Yeqing Zhang, PhD candidate in finance in the School of Economics and Management at Tsinghua University)
References
Berkowitz, Daniel, Chen Lin, and Yue Ma. (2015) “Do Property Rights Matter? Evidence from a Property Law Enactment.” Journal of Financial Economics, 116(3): 583–593.
Bloom, Nicholas, Mark Schankerman, and John Van Reenen. (2013) “Identifying Technology Spillovers and Product Market Rivalry.” Econometrica 81(4): 1347–1393.
Cai, Jing, and Ann Harrison (forthcoming). “Industrial Policy in China: Some Intended or Unintended Consequences.” Industrial and Labor Relations Review.
Cull, Robert, and Lixin Colin Xu (2005). “Institutions, Ownership, and Finance: The Determinants of Profit Reinvestment among Chinese Firms.” Journal of Financial Economics, 77(1): 117–146.
Griliches, Zvi (1991). “The Search for R&D Spillovers.” National Bureau of Economic Research.
Jones, Charles I., and John C. Williams (1998). “Measuring the Social Return to R&D.” Quarterly Journal of Economics, 113(4): 1119–1135.
Ke, Shaowei, Yao Lu, Xinzheng Shi, and Yeqing Zhang (2019). “Can Investment Incentives Crowd Out Innovation? Evidence from China.” Working Paper available at SSRN: https://ssrn.com/abstract=3459276
Liu, Yongzheng, and Jie Mao (2019). “How do Tax Incentives Affect Investment and Productivity? Firm-level Evidence from China.” American Economic Journal: Economic Policy, 11(3): 261–291.
Romer, Paul M. (1986). “Increasing Returns and Long-run Growth.” Journal of Political Economy, 94(5): 1002–1037.
Zhang, Lei, Yuyu Chen, and Zongyan He (2018). “The Effect of Investment Tax Incentives: Evidence from China’s Value-added Tax Reform.” International Tax and Public Finance, 25(4): 913–945.

Latest
Most Popular
- VoxChina Covid-19 Forum (Second Edition): China’s Post-Lockdown Economic Recovery VoxChina, Apr 18, 2020
- China’s Great Housing Boom Kaiji Chen, Yi Wen, Oct 11, 2017
- China’s Joint Venture Policy and the International Transfer of Technology Kun Jiang, Wolfgang Keller, Larry D. Qiu, William Ridley, Feb 06, 2019
- The Dark Side of the Chinese Fiscal Stimulus: Evidence from Local Government Debt Yi Huang, Marco Pagano, Ugo Panizza, Jun 28, 2017
- Wealth Redistribution in the Chinese Stock Market: the Role of Bubbles and Crashes Li An, Jiangze Bian, Dong Lou, Donghui Shi, Jul 01, 2020
- Evaluating Risk across Chinese Housing Markets Yongheng Deng, Joseph Gyourko, Jing Wu, Aug 02, 2017
- What Is Special about China’s Housing Boom? Edward L. Glaeser, Wei Huang, Yueran Ma, Andrei Shleifer, Jun 20, 2017
- Privatization and Productivity in China Yuyu Chen, Mitsuru Igami, Masayuki Sawada, Mo Xiao, Jan 31, 2018
- How did China Move Up the Global Value Chains? Hiau Looi Kee, Heiwai Tang, Aug 30, 2017
- China’s Shadow Banking Sector: Wealth Management Products and Issuing Banks Viral V. Acharya, Jun Qian, Zhishu Yang, Aug 09, 2017


